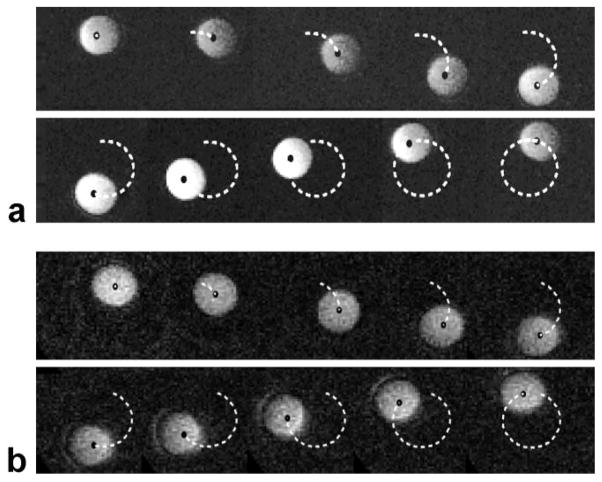
Figure 2.
a: Sample real-time images of the phantom rotating in the 1.5T scanner. The black dot represents the area centroid of the phantom. The dashed line represents the path traced by the phantom center (ie, the recorded position of the centroid of the sphere at each frame in the real-time MRI sequence). Due to constraints on coil position, the images lose signal as the phantom moves far from the coil; however, the tracking algorithm was still able to identify the pixels corresponding to the phantom. b: Sample real-time images of the phantom rotating in the 0.5T open-MRI scanner. The black dot represents the area centroid of the phantom. The dashed line represents the path traced by the phantom center.

