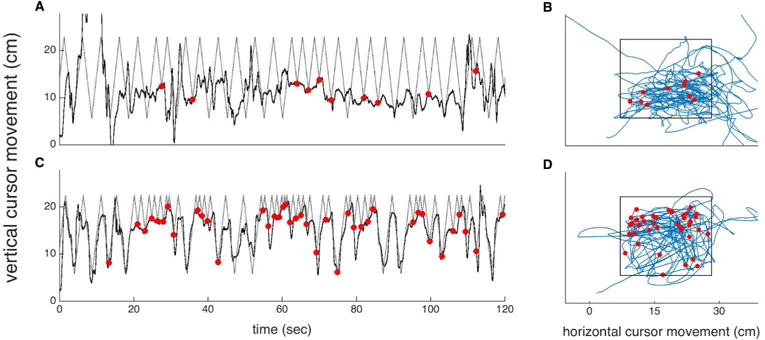
Fig. 3.

Increase in pong hit rate showed by sample pong trajectories from the very first 2-minute pong block in session 3 (top) compared to the very last 2-minute pong block from session 24 (bottom) played by a typical participant; (A) and (C) show the vertical paddle trajectory (thick line), ball vertical trajectory (dotted line) and the hits (red dots) vs. time; (B) and (D) show the paddle paths (blue lines) and the location of hits (red dots), the black rectangle marks the game area
