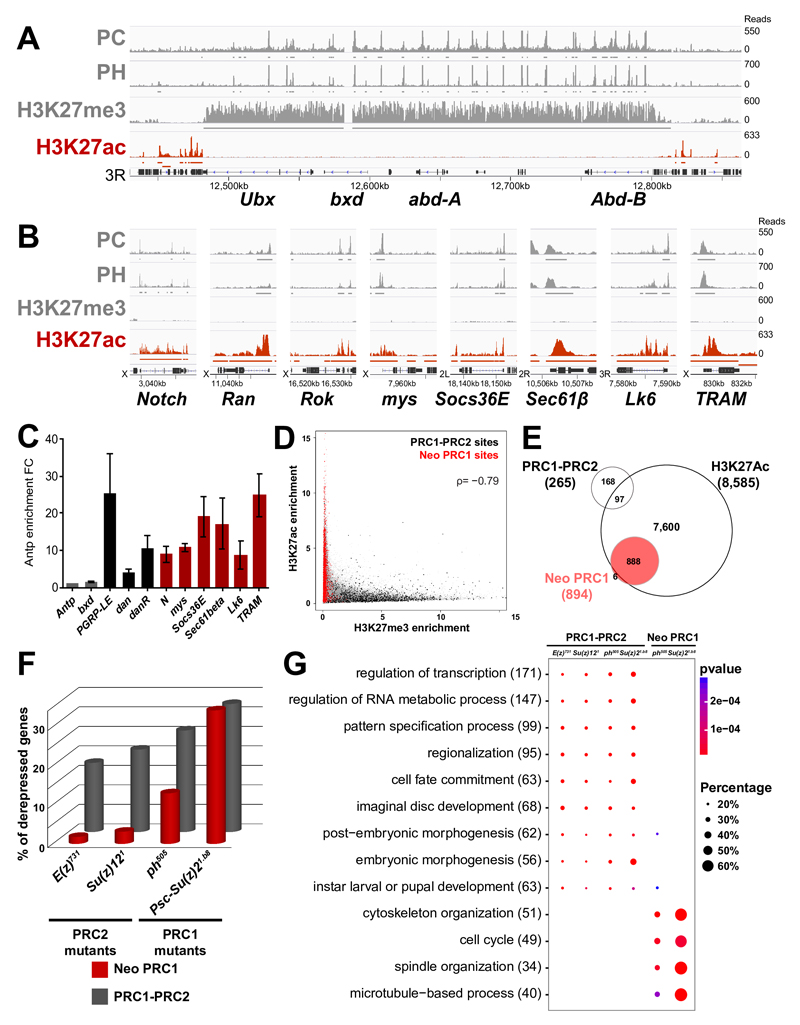
Fig. 3. PRC1 represses transcriptionally active neo PRC1 targets.
A- ChIP-Seq profiles for PC, PH, H3K27me3 and H3K27Ac in the BXC locus in eye imaginal discs. Enriched regions are shown under each ChIP-Seq track. B- ChIP-Seq profiles as above in a set of neo PRC1 target loci. C- qChIP against H3K27Ac on a set of canonical and neo PRC1 target genes. Results are normalized using the Antp gene (negative control). Error bars represent the s.d of three experiments. D- Scatter plot showing the ChIP-Seq distribution of H3K27me3 and H3K27Ac. PRC1-PRC2 target sites (in black) mainly carry H3K27me3 while neo PRC1 target sites (in red) carry H3K27Ac. The H3K27Ac and H3K27me3 enrichments are anti-correlated with a spearman’s rank correlation coefficient ρ of –0,79. E- Venn diagram showing the overlap of the different classes of PcG target genes with the H3K27Ac mark, based on genome-wide ChIP-Seq data analysis in eye imaginal discs. F- Percentage of upregulated genes in RNA-seq of PRC1 (ph505 and Psc1.b8) or PRC2 (E(z)731 and Su(z)121) mutant eye discs. G- Comparative Gene Ontology (GO) analysis of genes upregulated in PRC1 (ph505 and Psc1.b8) or PRC2 (E(z)731 and Su(z)121 ) mutants, stratified by categories of PcG ChIP-Seq targets. The total number of upregulated genes in each GO category is indicated in brackets. The fraction of bound genes that are upregulated in each category of PcG targets and the p-values are indicated by the size and the color of each spot.

