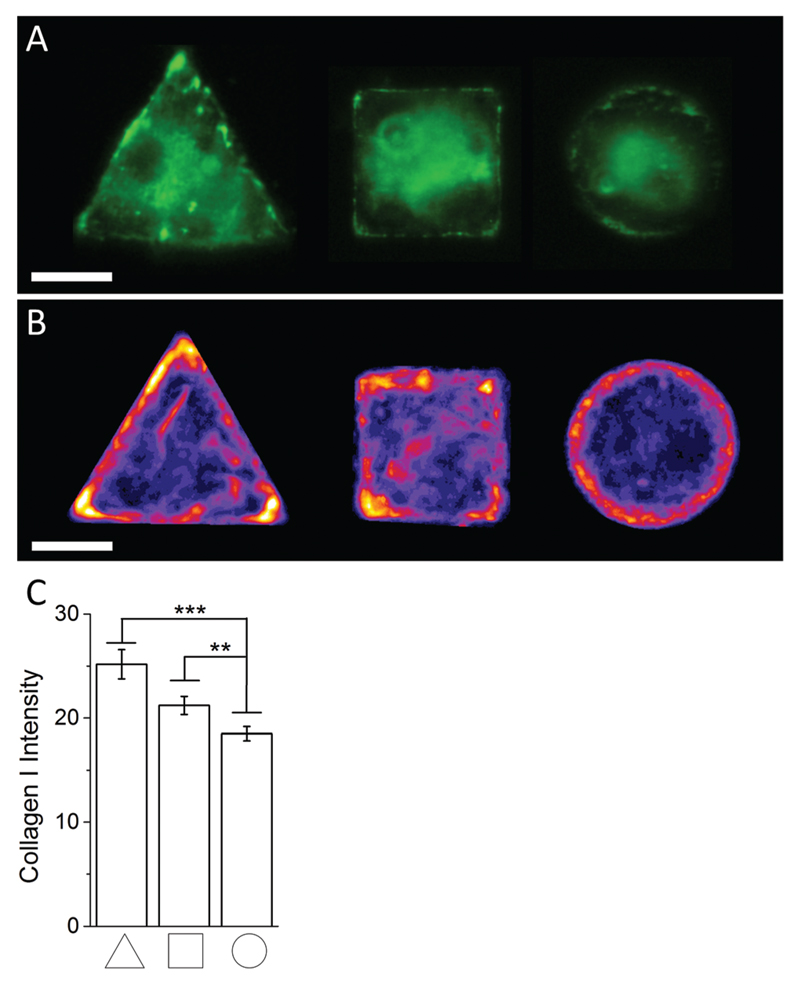
Fig. 4.
(A) Representative immunofluoresence images of micropatterned hMSCs stained against collagen I. (B) Immunofluoresence intensity heatmaps of triangular, square, and circular shaped micropatterned hMSCs stained against collagen I illustrate the previously observed localisation dependent signal intensity and overall collagen I abundance across the whole cell population quantitatively. Scale bar = 20 µm. (C) Immunofluorescence image quantification of the average signal intensity of micropatterned hMSCs stained against collagen I.

