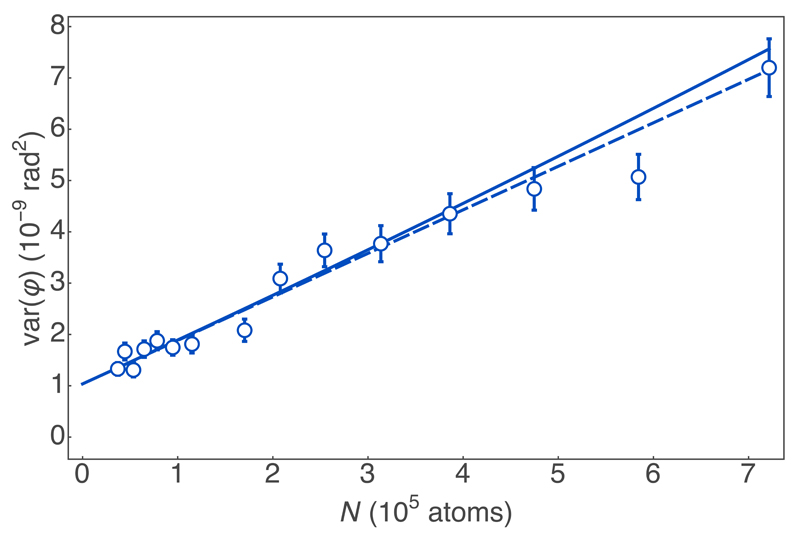
Extended Data Fig. 2.
Calibration of average Faraday rotation signal. We calibrate the rotation angle φ against input atom number N, measured via absorption imaging. Solid line, the fit curve φ = a0 + µ1N, with we obtain µ1 = (7.07 ± 0.04) × 10−8 and a0 = (3.9 ± 0.3) × 10−3. Error bars indicate ±1 s.e.m.

