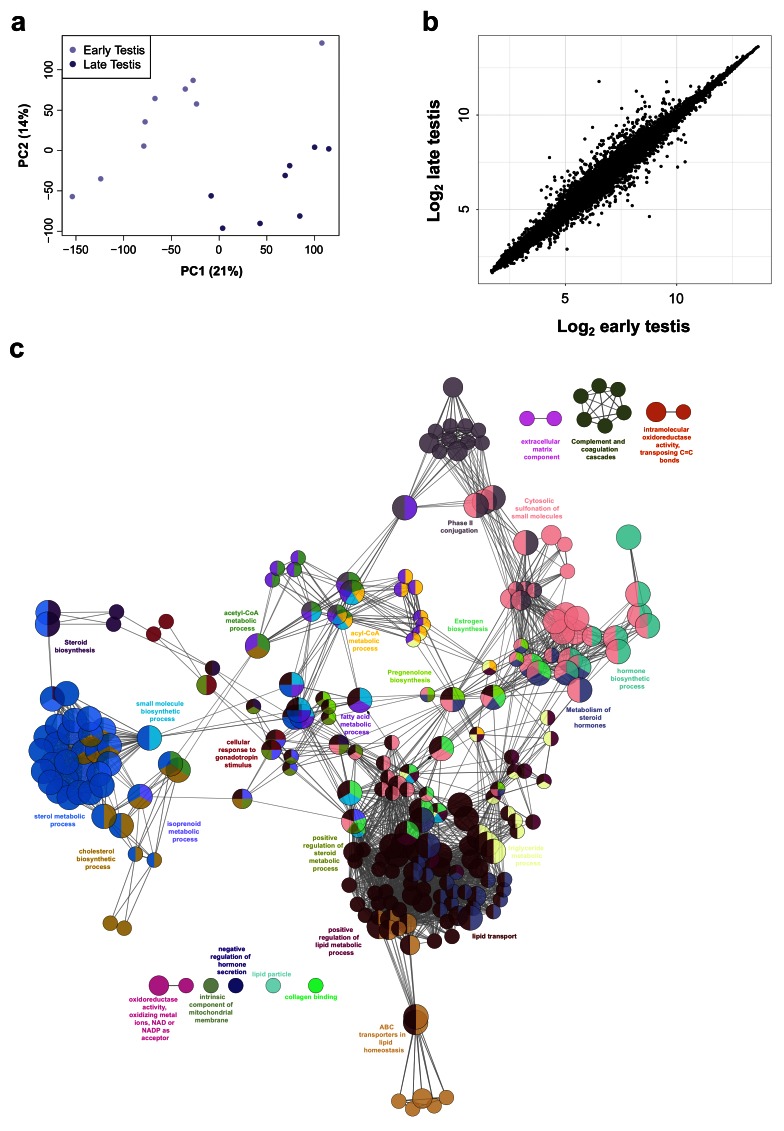
Figure 10. Differentially expressed genes in early compared to late testis samples.
( a) Principal component analysis of early ( N=9) compared to late ( N=8) testis samples. The scatter plot shows samples plotted on the two first principal components (PC1, PC2). ( b) Correlation plot for log 2 mean gene expression levels in the early testis (CS18 to CS22) versus late testis (F1 to F3) samples (Pearson’s product-moment correlation test correlation coefficient=0.992, P-value< 2.2e-16). ( c) Pathway-enrichment analysis using ClueGO for differentially up-regulated genes in early testis compared to late testis samples (log 2FC≥1, P-value≤0.01).

