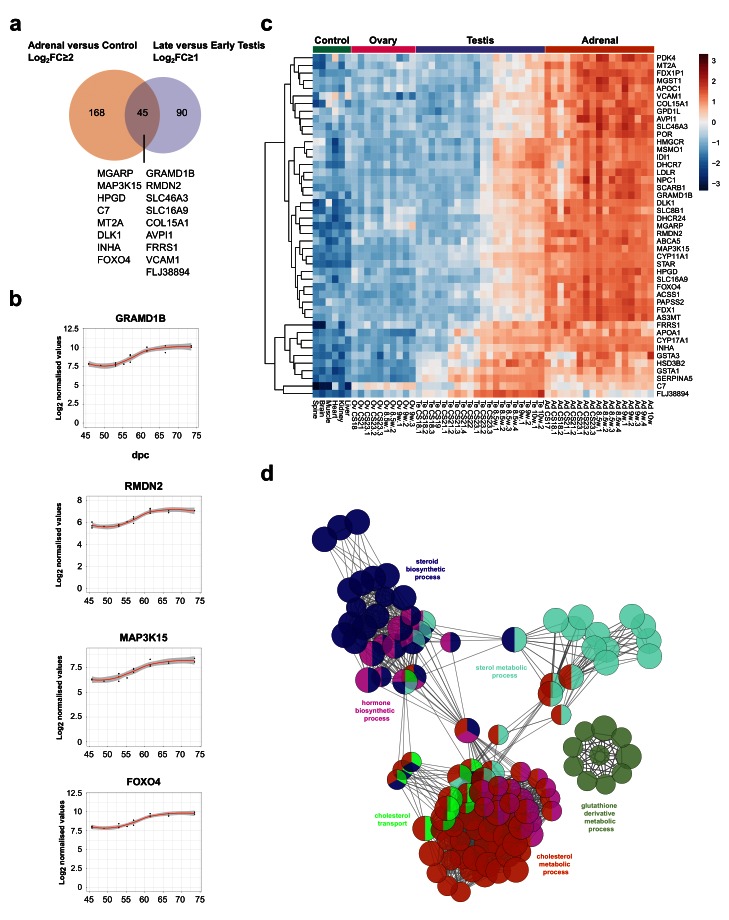
Figure 11. Identification of novel steroidogenesis genes.
( a) Venn diagram displaying the overlap for up-regulated genes between adrenal and control samples (log 2FC≥2) with late versus early testis samples (log 2FC≥1). A subset of genes found in the intersection are displayed, which are not yet established components of steroidogenesis. In all cases, P-value≤0.05. ( b) Scatter plots showing changes in gene expression patterns for four novel factors, GRAMD1B, RMDN2, MAP3K15, and FOXO4. The plot shows normalised gene expression values for testis samples between approximately 46 and 74 dpc. Loess method was used for fitting a smooth curve between variables. ( c) Heatmap representing normalised gene expression values for the 45 genes identified in the intersection between adrenal versus control and late testis versus early testis. The intensity of gene expression is indicated by a colour scale: blue for lowest and red for highest expression levels. Row-based unsupervised hierarchical clustering was performed. ( d) Pathway-enrichment analysis using ClueGO for the 45 genes identified in the intersection shown in ( a).

