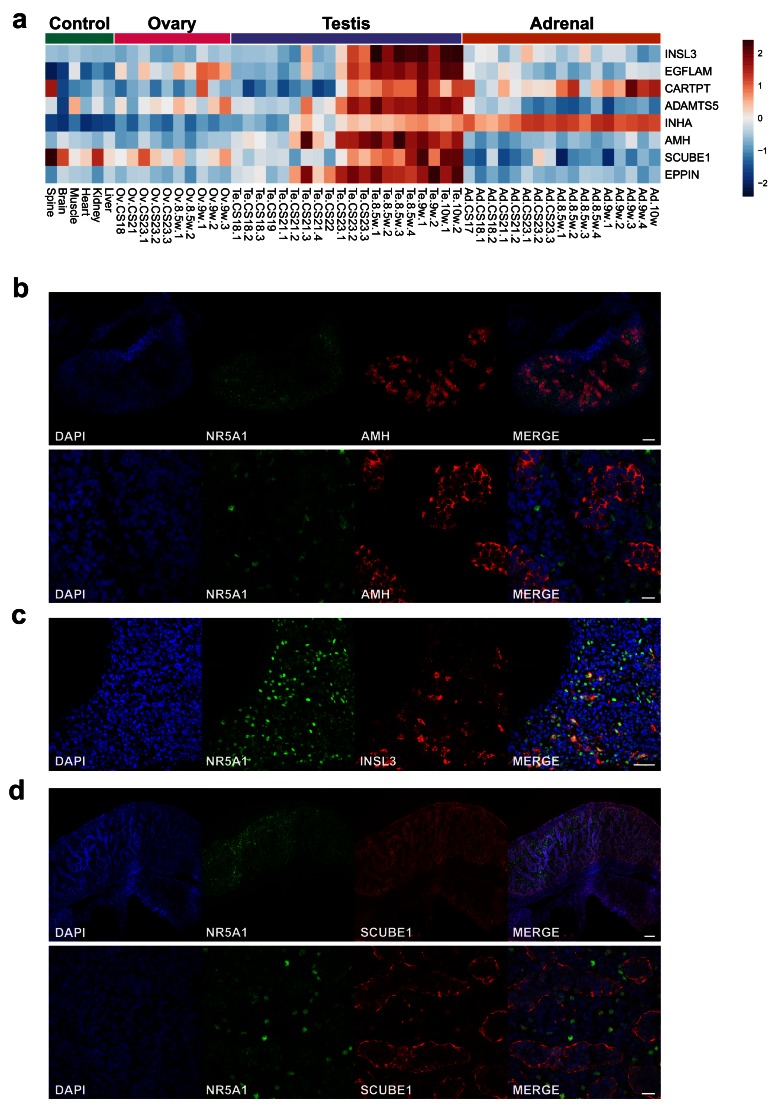
Figure 13. Identification of potential testis-secreted proteins.
( a) Heatmap representing normalised gene expression values for potential secreted proteins. The intensity of gene expression is indicated by a colour scale: blue for lowest and red for highest expression levels. ( b) Immunohistochemistry for AMH (MIS) in human fetal testis at 9 wpc. NR5A1 (SF-1) was used to highlight Leydig cells (green). DAPI was used to counterstain nuclei (blue) and to highlight the outer capsule. Scale bars, 100 µm (top panels) and 20 µm (bottom panels) ( c) Immunohistochemistry for INSL3 in human fetal testis at 9 wpc. NR5A1 (SF-1) was used to highlight Leydig cells (green). DAPI was used to counterstain nuclei (blue). Scale bar, 50 µm ( d) Immunohistochemistry for SCUBE1 in human fetal testis at 9 wpc. NR5A1 (SF-1) was used to highlight Leydig cells (green). DAPI was used to counterstain nuclei (blue). Scale bars, 100 µm (top panels) and 20 µm (bottom panels).

