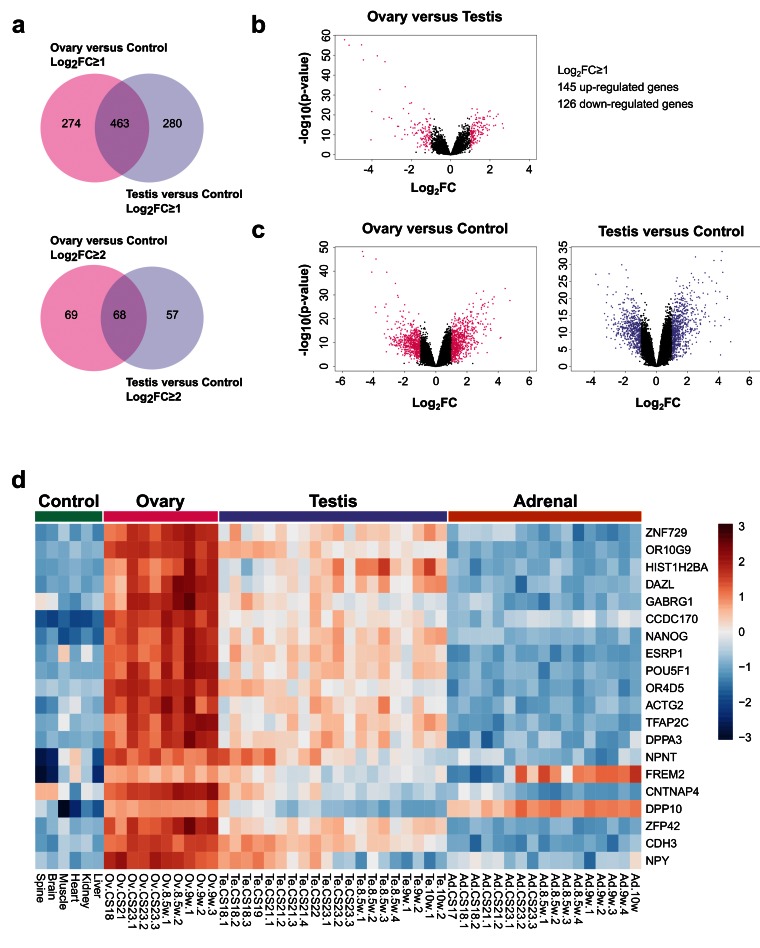
Figure 14. Ovary development dynamics.
( a) Venn diagram displaying the overlap for up-regulated genes between ovary and control versus testis and control samples using log 2FC≥1 (upper panel) and log 2FC≥2 (lower panel) cut-offs. P-value≤0.05. ( b) Volcano plot analysis of differentially expressed genes in ovary versus testis samples. Genes with an absolute log 2FC≥1 and P-value≤0.05 are shown in pink. ( c) Volcano plot analysis of differentially expressed genes in the ovary versus control samples (left panel) and testis versus control samples (right panel). Genes with an absolute log 2FC≥1 and P-value≤0.05 are shown in pink and purple respectively. ( d) Heatmap representing normalised gene expression values for the top 20 differentially expressed genes found only in the ovary versus control samples, using a log 2FC≥2 cut-off. The intensity of gene expression is indicated by a colour scale: blue for lowest and red for highest expression levels. P-value≤1e-5. Genes are ordered according to decreasing log 2FC values.

