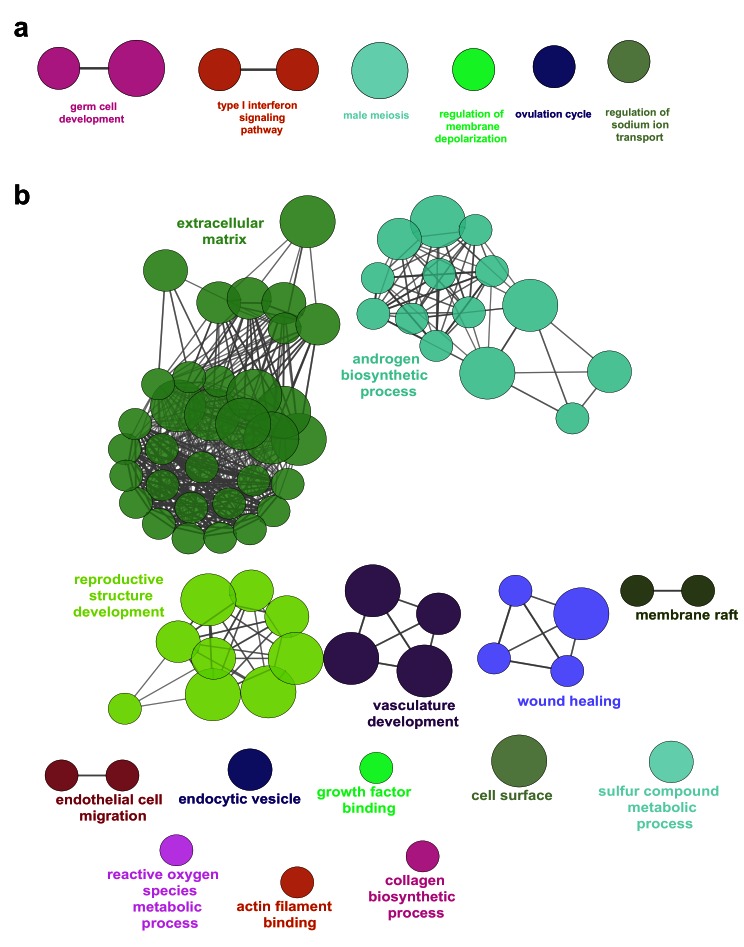
Figure 15. Pathway enrichment analysis of ovary-specific genes.
( a) Pathway-enrichment analysis using ClueGO for differentially up-regulated genes in the ovary compared to control, with testis up-regulated genes excluded (log 2FC≥1, P-value≤0.05). ( b) Pathway-enrichment analysis using ClueGO for differentially up-regulated genes in the testis compared to control, with ovary up-regulated genes excluded (log 2FC≥1, P-value≤0.05).

