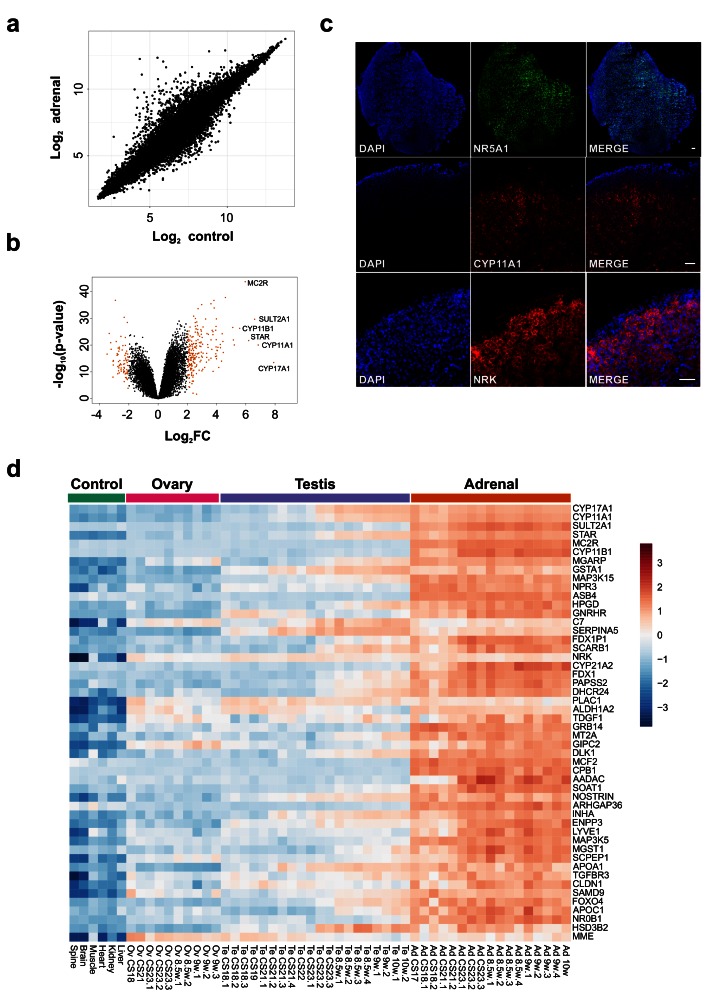
Figure 4. Differential expression of genes in the adrenal gland.
( a) Correlation plot for log 2 mean gene expression levels in the adrenal versus control samples (Pearson’s product-moment correlation test correlation coefficient=0.96, P-value≤ 2.2e-16). ( b) Volcano plot analysis of differentially expressed genes in adrenal versus control samples. Genes with a log 2FC≥2 (or log 2FC≥-2) and P-value≤0.000005 are shown in orange. ( c) Immunohistochemistry of NR5A1, CYP11A1 and NRK in the human adrenal gland (9 wpc). Nuclei are stained blue with DAPI, which also highlights the outer capsule. Scale bars, 100 µm. ( d) Heatmap representing normalised gene expression values for the top 50 differentially up-regulated adrenal genes compared to control samples across the whole sample dataset. Genes are ordered according to descending log 2FC values. The intensity of gene expression is indicated by a colour scale: blue for lowest and red for highest expression levels. For all samples shown, P-value≤1e-10.

