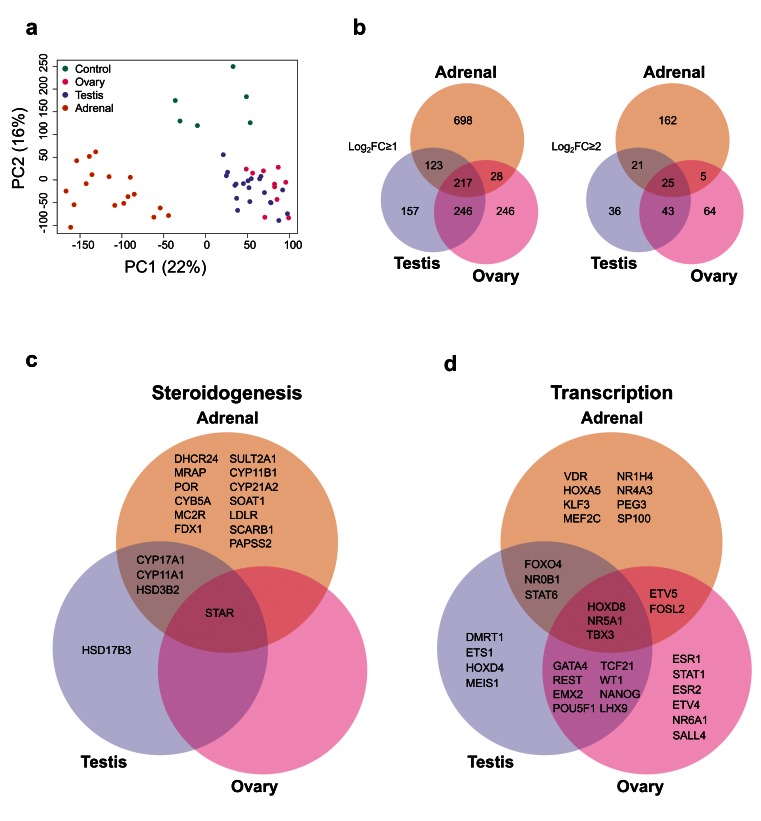
Figure 2. Differential gene expression in adrenal gland, testis and ovary compared to controls.
( a) Principal component analysis of the 53 samples included in the study (17 adrenal, 20 testes, 10 ovary and 6 controls). The scatter plot shows the position of samples based on the two first principal components (PC1, PC2). ( b) Venn diagram showing the overlap between differentially up-regulated genes in the adrenal, testis and ovary compared with control samples using either log 2FC≥1 or log 2FC≥2. ( c) Selected examples of differentially up-regulated genes (log 2FC≥2) involved in steroidogenesis ( d) Selected transcription factors differentially expressed in each tissue (log 2FC≥1). For all comparisons, P-value≤0.05.

