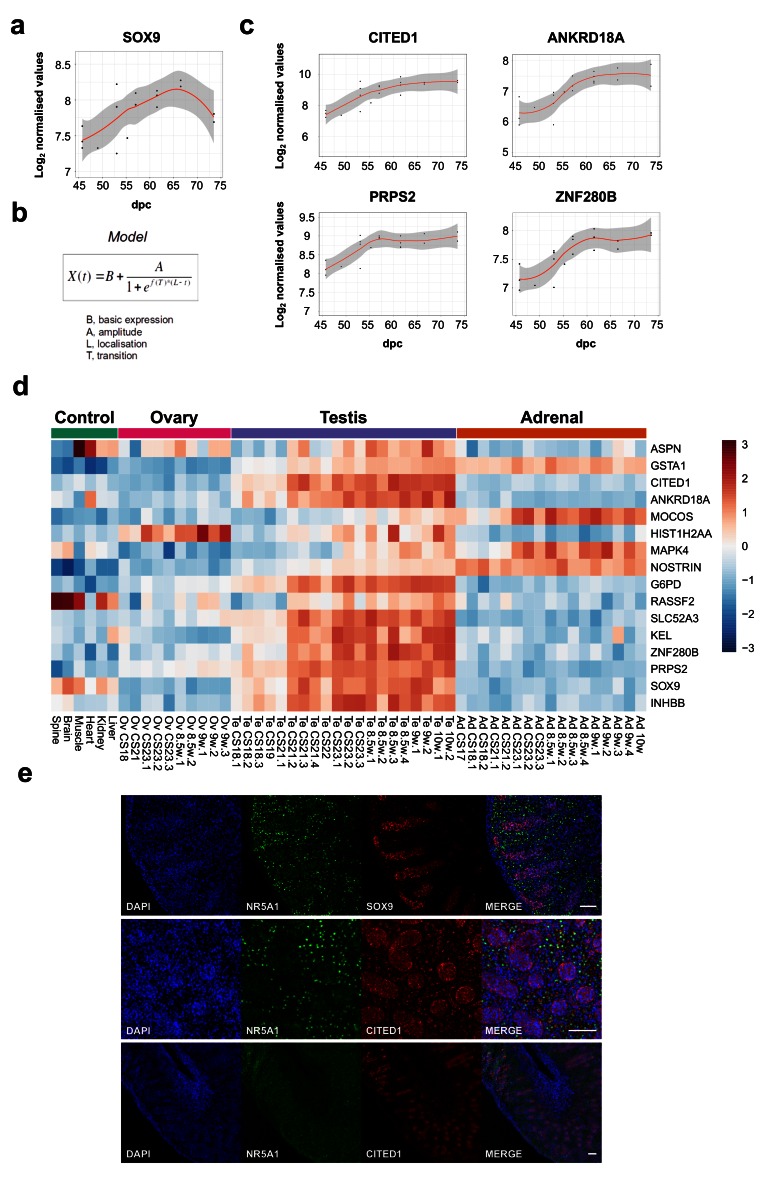
Figure 8. Identification of potential genes downstream of SRY using the BALT model.
( a) Scatter plot showing curvilinear upregulation of SOX9 during testis development (45 to 74 dpc). Loess method was used for fitting a smooth curve between variables. ( b) Equation used in the BALT mathematical model (see methods for details). ( c) Scatter plots showing changes in gene expression patterns for CITED1, ANKRD18A, PRPS2 and ZNF280B in the developing testis (45 to 74 dpc). Loess method was used for fitting a smooth curve between variables. ( d) Heatmap representing normalised gene expression values for genes showing similar expression patterns to SOX9, based on the BALT mathematical model. The intensity of gene expression is indicated by a colour scale: blue for lowest and red for highest expression levels. For all samples shown, P-value≤0.005. ( e) Immunohistochemistry for NR5A1 (SF-1, staining Leydig cells), SOX9, and CITED1 in the human fetal testis (11 wpc). Nuclei are counterstained blue with DAPI. Scale bars, 100 µm.

