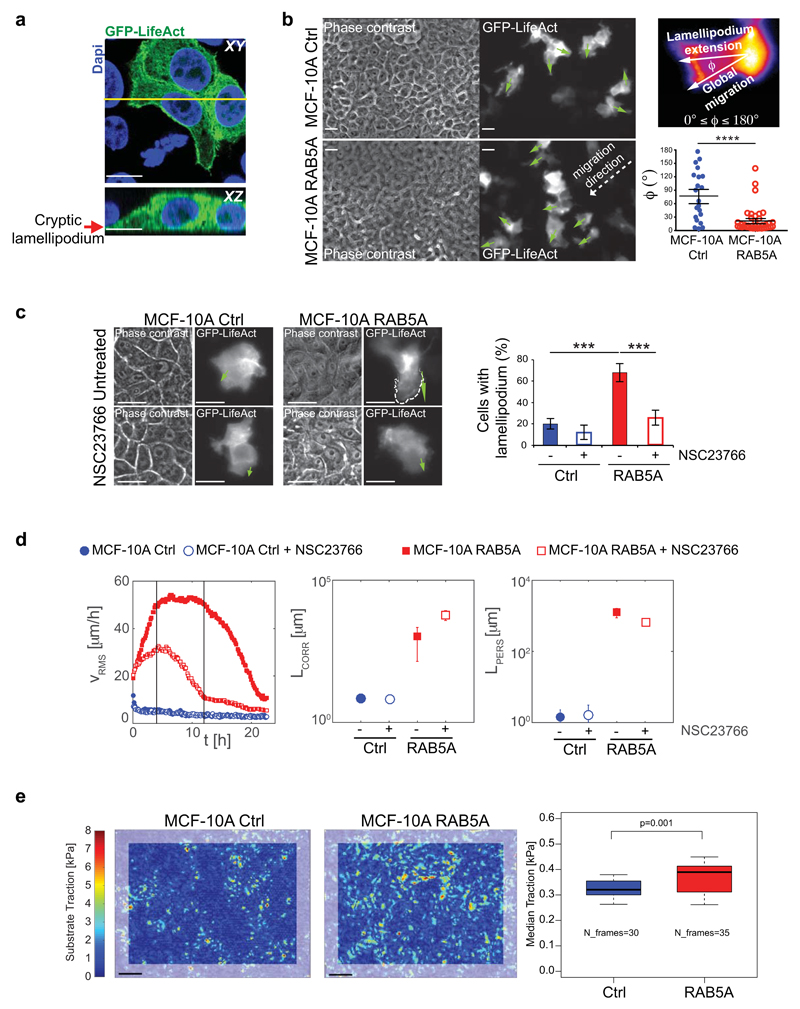
Figure 4. RAB5A promotes polarized cell protrusions and traction forces.
(a) Mixed (1:10 ratio) GFP-LifeAct-expressing (green):non-expressing control MCF-10A cells were processed for epifluorescence or stained with Dapi (Blue). Arrow points to a cryptic lamellipodium. The yellow line indicates the region of XY projection shown in the XZ plane in the bottom image. Scale bars, 15 µm.
(b) Left images: still phase contrast and fluorescent images of the extension and orientation of cryptic lamellipodia in unwounded control and RAB5A-MCF-10A monolayers composed of mixed (1:10 ratio) GFP-LifeAct-expressing (green):non-expressing cells monitored by time-lapse microscopy (Supplementary Movie 14). Green arrows indicate the orientations of protrusions. Scale bars, 15 μm. Top right image: representation of the angle Φ between the direction of each lamellipodium and the direction vector of a moving collective pack (group migration); Φ ~ 0° indicates that protrusions and group migration have the same direction; Φ > 80° indicates that the directions of protrusions and group migration are diverging. Bottom right plot: Quantification of the orientation angle Φ (n= 25/condition from 5 independent experiments). Data are the mean ± SEM. ****p<0.0001
(c) Left images: fluorescent still images depicting cryptic lamellipodia in untreated and NCS23766 (a RAC1 inhibitor)-treated unwounded control and RAB5A-monolayers composed of GFP-LifeAct-expressing (green) and non-expressing cells seeded at a 1:10 ratio and monitored by time-lapse fluorescence microscopy (Supplementary Movie 15). Green arrows indicate the orientation of a typical protrusion. Scale bars, 15 μm. Right plot: Proportion of cells with lamellipodium. Data are the mean ± SD (n=80 cell/condition in 3 independent experiments). ***p < 0.0005.
(d) From left to right: temporal evolution of the root mean square velocity υ RMS, velocity correlation lengths Lcorr and persistence lengths Lpers calculated by PIV analysis of control and RAB5A-MCF-10A monolayers seeded at jamming density and treated with the RAC1 inhibitor NSC23766 or vehicle and monitored by time-lapse phase contrast microscopy (Supplementary Movie 16). At least 5 movies/experimental condition were analysed in 3 independent experiments.
(e) Left images: substrate tractions of control and RAB5A monolayers measured using cTFM30. Grey frames correspond to areas excluded from analysis due to boundary effects. Scale bars, 25 μm. Right plot: the median traction analysed from n time points, obtained from 5-6 fields of view out of 2 independent experiments. p-value calculated with Mann-Whitney-U-Test.

