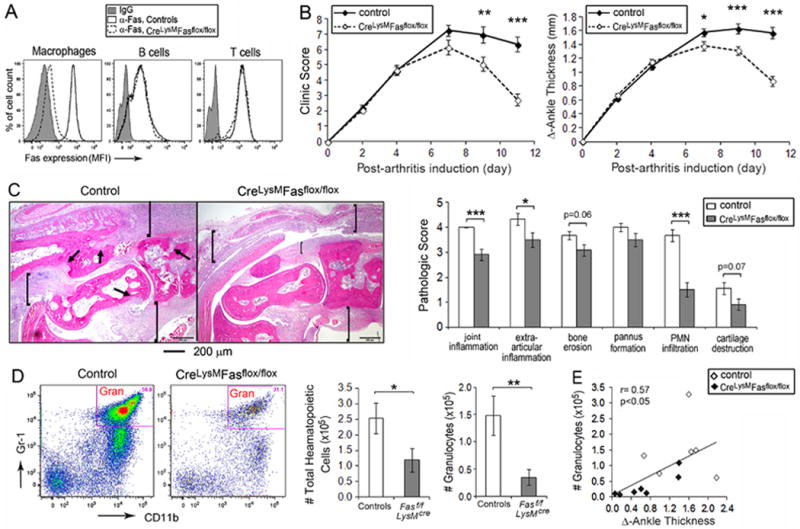
Figure 1. Reduced anti-GPI serum induced arthritis in mice with Fas deficiency in the myeloid lineage.

(A) Fas membrane expression on cells isolated from the resident peritoneal cavities of Fasf/f, LyzMcre and the controls were examined by Flow cytometry. Representative imaging for Fas expression level is indicated by the mean fluorescent intensity (MFI) on the surface of peritoneal macrophages, B cells and T cells. (B) The course of the arthritis was determined by the clinical activity score (0-3 for each limb, maximum of 12, right panel) and the change of ankle swelling (∆ ankle thickness in mm for hind ankles, left panel), determined between day s 2 and11 post arthritis induction. Data w ascombined from 5 individual experiments, with a total of 19-36 mice at each time point for each group. (C) Representative H&E histology imaging from the ankles of control and Fasf/f, LyzMcre mice (left panel) and the comparison of histological scoring (mean ± SE) between ankles from 9 controls and 12 Fasf/f, LyzMcre mice harvested on day 11 post -arthritis induction (right panel). The arrows identify bone erosion and pannus formation and the brackets articular and extra-articular inflammation. (D) Flow cytometry analysis of cells isolated from the joints harvested on day 11 post-arthritis induction, and the total number cells isolated from the joints (mean ± SE) for the control (n=6) and Fasf/f, LyzMcre (n=7) mice. Hematopoietic cells were identified by CD45 positivity. Granulocytes were identified by CD45+, CD11c-, CD11b+ and Gr1+ staining. Gran, granulocyte. (E) The correlation between the number of granulocytes and ankle swelling (∆ ankle thickness) was analyzed by data obtained from the same ankles indicated in panel (C). * represents p< 0.05, ** p < 0.01 and *** p < 0.001 between the indicated groups.
