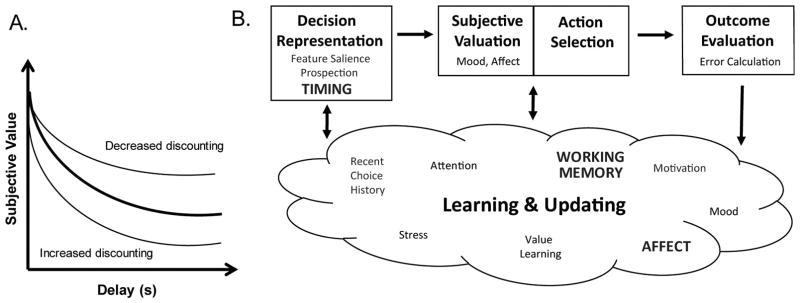
Figure 1.
A. Example delay discounting curves. Such curves are generated using the choice behavior from delay discounting tasks, and delay discounting rates and decision tendencies are derived from them. The thick black line in the center represents a typical discounting curve, while the thin lines represent a decreased discounting/ ‘patient’ curve (top) and an increased discounting/ ‘impulsive’ curve (bottom). B. A schematic of the five behavioral and computational subprocesses that comprise the intertemporal decision making process (adapted from Rangel et al. (2008)). First, an individual represents the decision problem. Next, they assign each option a value through a valuation process. Third, they compare the computed values and select the action associated with the greatest value (action selection). Fourth, they compare the experienced value against that which they expected (outcome evaluation); and finally, they update their decision representations, valuations, and choices through learning, memory, and motivational mechanisms. (Of note is the fact that even though it is easy to conceive of subjective valuation and action selection as distinct processes, it is difficult to disentangle the two because a basic assumption of decision theory is that the chosen option is by definition the most valuable option.). In addition to the behavioral subprocess labels, the schematic is also populated with the psychological variables that have been identified in human and rodent studies. Only those that have been identified in both species are bolded.

