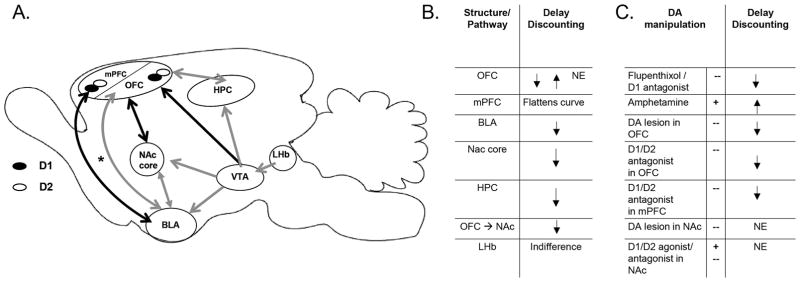
Figure 2.
A. Anatomical circuit representation showing structures and pathways involved in rodent intertemporal decisions. Structures and DA receptors are only included if silencing with lesions, inactivation, or blockade altered rodent delay discounting. Solid black lines indicate the pathways that are required for normal discounting performance; whereas solid grey lines represent pathways that are not necessary for normal performance. Pathways marked by dotted grey lines have yet to be tested during delay discounting tasks; and the dotted black line (and asterisk) shows a pathway that has been implicated in choice of a single delayed choice but has yet to be tested during a discounting task. B. The first table lists the changes to delay discounting curves that resulted from silencing structures and disconnecting a pathway. C. The second table lists the changes to delay discounting curves that resulted from pharmacologically manipulating DA signaling. (⭡) decreased discounting; (⭣) increased discounting/impulsive choice; NE- no effect; + stimulated DA signaling; -- blocked DA signaling; BLA-basolateral amygdala; HPC-hippocampus; LHb-lateral habenula (inactivation leads to indifference (Colin M Stopper & Floresco, 2013)); mPFC-medial prefrontal cortex; NAc-nucleus accumbens; OFC-orbitofrontal cortex; VTA-ventral tegmental area. D.

