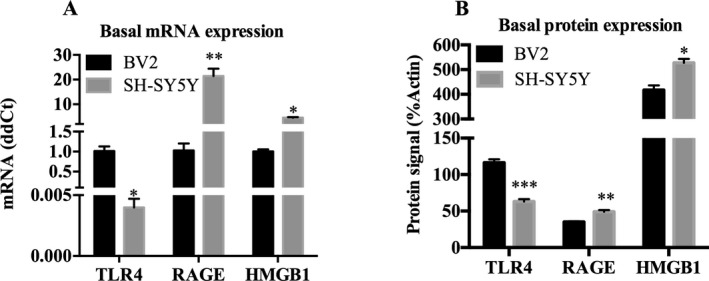
Figure 2.

Microglia‐like BV2 and neuron‐like SH‐SY5Y express mRNA and protein of various proinflammatory molecules. (A) Comparison of basal mRNA expression of TLR4, RAGE, and HMGB1 in BV2 and SH‐SY5Y. Data are expressed in ddCt normalized to BV2 expression level. SH‐SY5Y express less TLR4 but greater RAGE and HMGB1 mRNA. (B) Basal protein levels of TLR4, RAGE, and HMGB1 were examined using Western blot in BV2 and SH‐SY5Y. Data are expressed in %β‐actin units. SH‐SY5Y express less TLR4 but greater RAGE and HMGB1 protein. n = 3 per group; *p < 0.05, **p < 0.01, ***p < 0.001 versus BV2.
