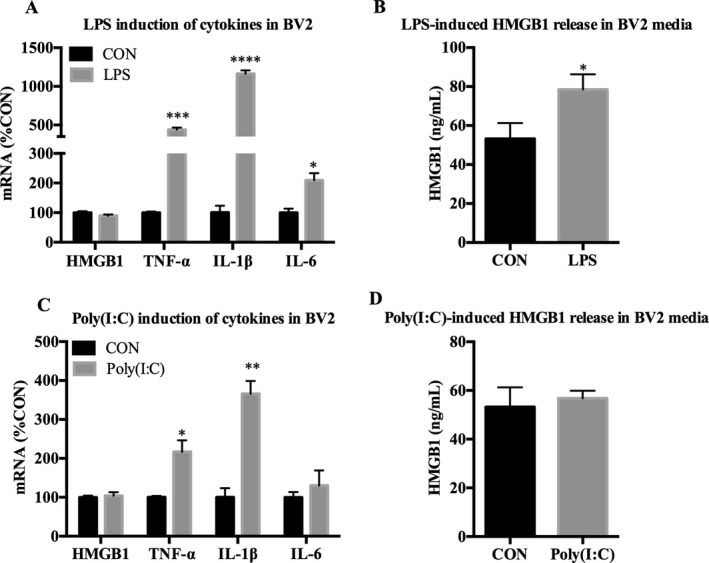
Figure 4.

LPS and Poly(I:C) up‐regulates cytokine expression in microglia‐like BV2. BV2 were treated with either LPS (100 ng/ml) or Poly(I:C) (50 μg/ml) for 24 hours followed by mRNA analysis in cell lysates and analysis of HMGB1 release in media using ELISA. (A) LPS increased TNF‐α (814%), IL‐1β (2,775%), and IL‐6 (209%) mRNA. (B) LPS increased HMGB1 release in media by 37%. (C) Poly(I:C) increased TNF‐α (217%) and IL‐1β (366%) mRNA. (D) Poly(I:C) did not induce HMGB1 release in media. Data for mRNA are expressed as %control (%CON), with CON set at 100%. n = 3 per group; *p < 0.05, **p < 0.01, ***p < 0.001, ****p < 0.0001 versus CON.
