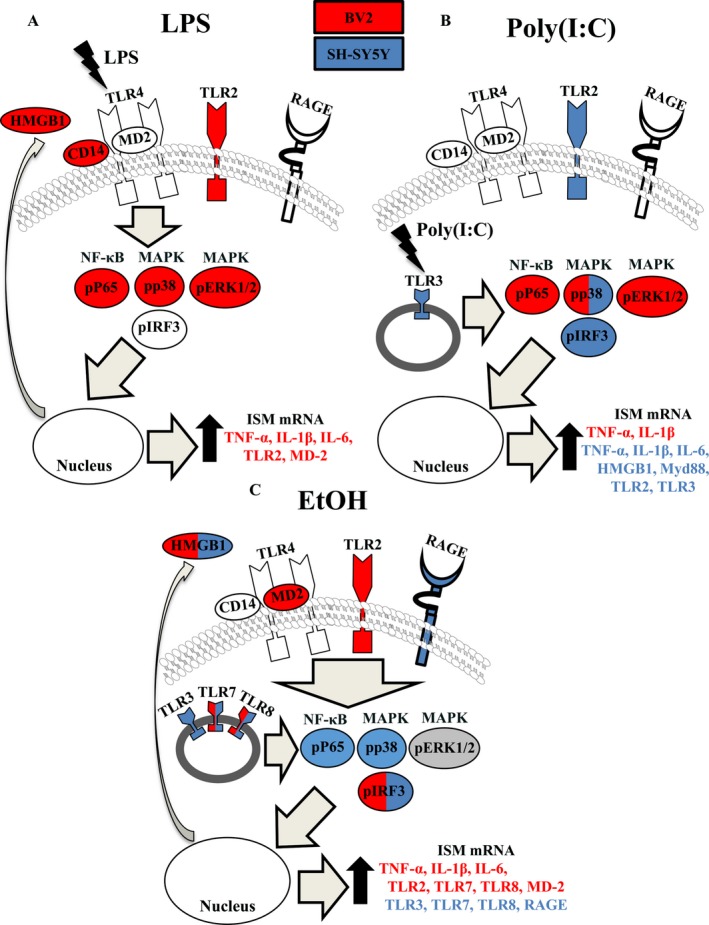
Figure 9.

EtOH instigates broader proinflammatory changes than TLR4‐LPS or TLR3‐Poly(I:C) alone in either microglia‐like BV2 or neuron‐like SH‐SY5Y. Red = increased in BV2; blue = increased in SH‐SY5Y; gray = decreased in both cell types; white = unchanged in both cell types.
