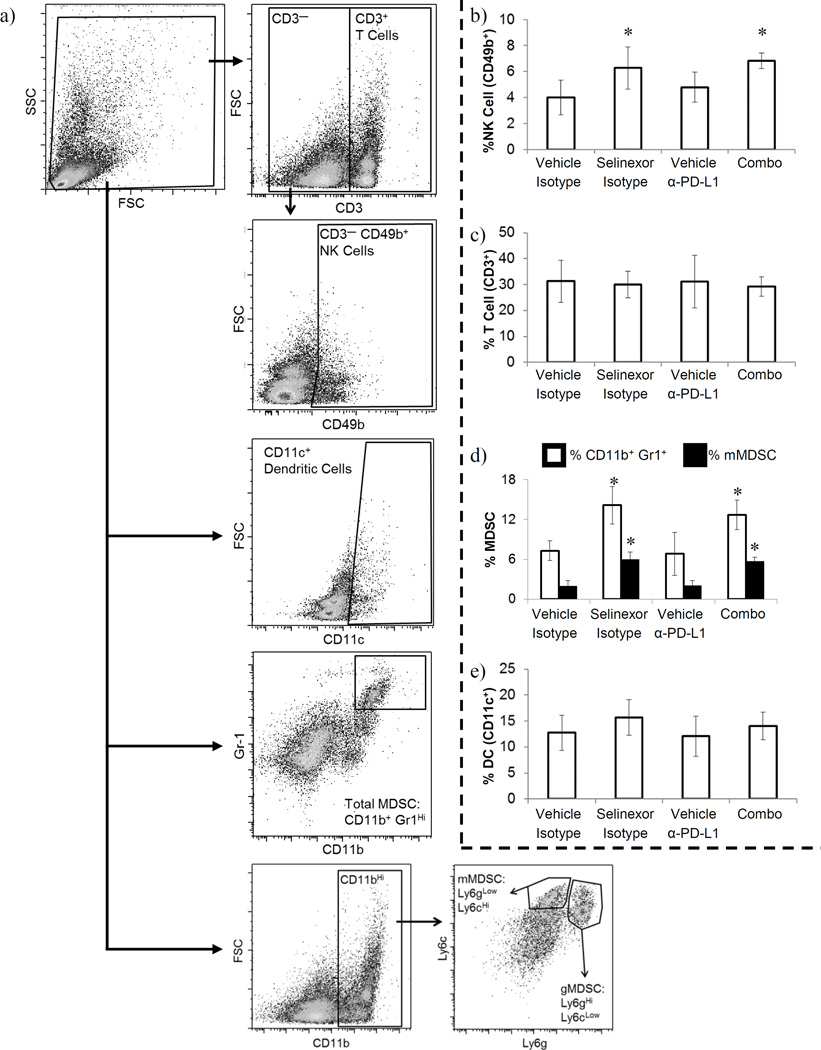
Figure 3. Selinexor plus anti-PD-L1 antibody alters immune cell frequencies in melanoma bearing animals.
The frequency of splenic immune cell subsets was determined by flow cytometry. (a) Gating strategy. Cells were initially gated for viable populations, on the basis of forward and side scatter. Subsequently, T cells were identified by gating on CD3+ cells and NK cells identified by gating on CD3− CD49b+ cells. DCs were identified by gating on CD11c+ cells. MDSCs were identified both by gating on CD11b+ Gr1+ double positive cells (white bars) or by first gating on CD11b+ cells and then gating on Ly6CHi Ly6GLow (monocytic MDSC, black bars) or Ly6GHi Ly6CLow (granulocytic MDSC, data not shown) cells. Representative FACS plots. (b) NK cell frequency, (c) T cell frequency, (d) MDSC frequency, (e) DC frequency. (b–e) n=5–6 mice per group; Mean ± S.D.; *, p<0.05 as compared to vehicle + isotype control.

