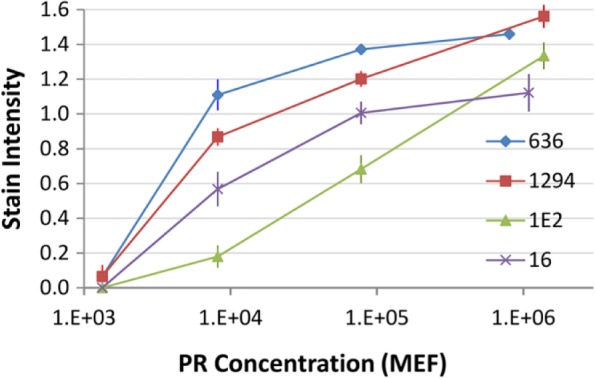
Figure 5.

Stain intensity curve as a function of PR concentration per microbead. Each data point is the mean ± SD of three replicate slides. Abbreviations: PR, progesterone receptor; MEF, molecular equivalents of fluorochrome; SD, standard deviation.
