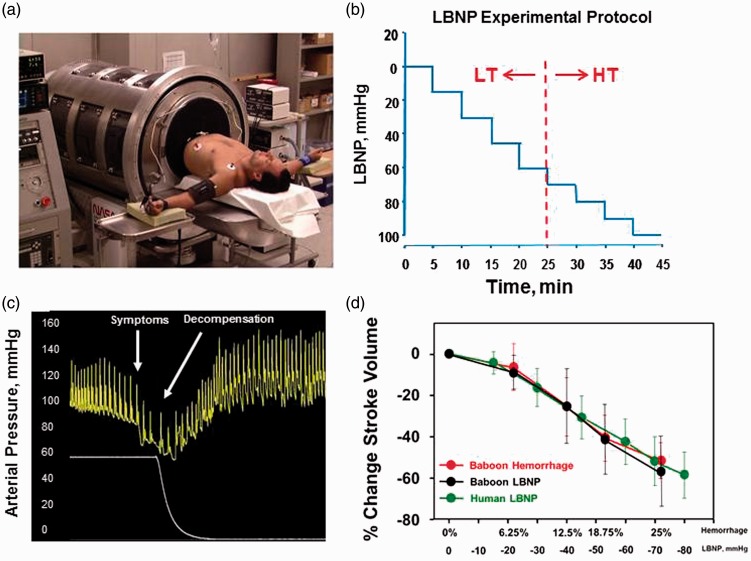
Figure 1.
(a) Human subject undergoing lower body negative pressure (LBNP). (b) Depiction of standard protocol with definition of high tolerant and lower tolerant subjects. (c) Representative figure of an arterial pressure waveform during LBNP leading to decompensation. (d) Percent change in stroke volume from baseline during four steps of hemorrhage ( ) and LBNP (•) in baboons corresponding to 6.25% (n = 14), 12.5% (n = 14), 18.75% (n = 14) and 25% (n = 12) total blood volume loss. Human responses to six levels of LBNP are superimposed (
 ). Data are expressed as mean ± SD. Modified from Convertino et al.27 and Hinojosa-Laborde et al.9

