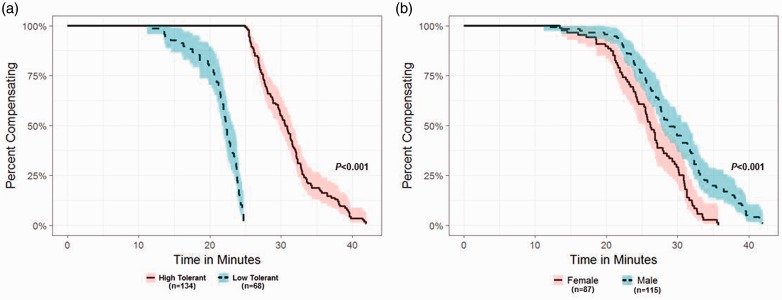
Figure 2.
Kaplan–Meier analysis of healthy human subjects undergoing LBNP until symptoms of presyncope are evident. Both panels utilize the same data. (a) Analysis of time to presyncope in minutes in subjects categorized as high tolerant or low tolerant. (b) Analysis of time to presyncope (minutes) in subjects categorized as male or female. (A color version of this figure is available in the online journal.)

