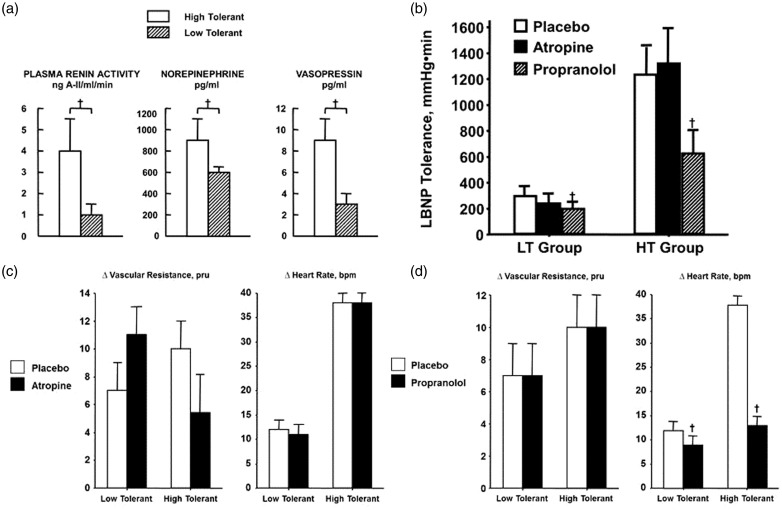
Figure 5.
(a) Plasma renin-angiotensin activity, norepinephrine, and vasopressin levels at decompensation in high-tolerant (open bars) and low-tolerant (lined bars) subject groups. Bars and lines represent mean ± 1 sem. † P < 0.05 compared with corresponding LT value. Modified from Convertino and Sather.29 (b) LBNP tolerances during placebo (open bar), atropine (closed bar), and propranolol (lined bar) treatments in low (LT, n = 5) and high (HT, n = 6) LBNP-tolerant individuals. Symbols are mean ± 1 sem. †P < 0.05 compared with corresponding LT value. Modified from Convertino and Sather.23 (c) Changes (Δ) in peripheral vascular resistance and heart rate during placebo (open bar) and atropine (closed bar) treatments in low (n = 5) and high (n = 6) LBNP-tolerant individuals. Symbols are mean ± 1 sem. Modified from Convertino.30 (d) Changes (Δ) in peripheral vascular resistance and heart rate during placebo (open bar) and propranolol (closed bar) treatments in low (n = 5) and high (n = 6) LBNP-tolerant individuals. Symbols are mean ± 1 sem. †P < 0.05 compared with corresponding LT value. Modified from Convertino.30

