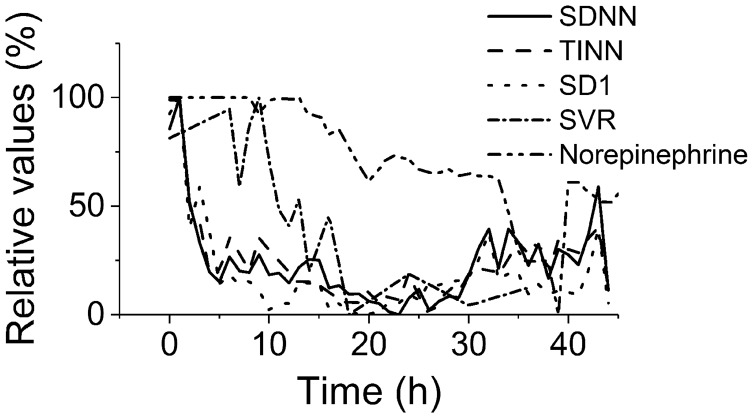
Figure 5.
Time relationships of HRV and hemodynamics. Expressed in relative values (100% corresponds to baseline). Depression of HRV parameters (SDNN, full line, TINN, dashed line, and SD1, dotted line) preceded the hemodynamic instability (systemic vascular resistance, dash-and-dotted line; reverse norepinephrine dose calculated as a difference of the respective dose and baseline 100%, double-dot-and-dashed line)

