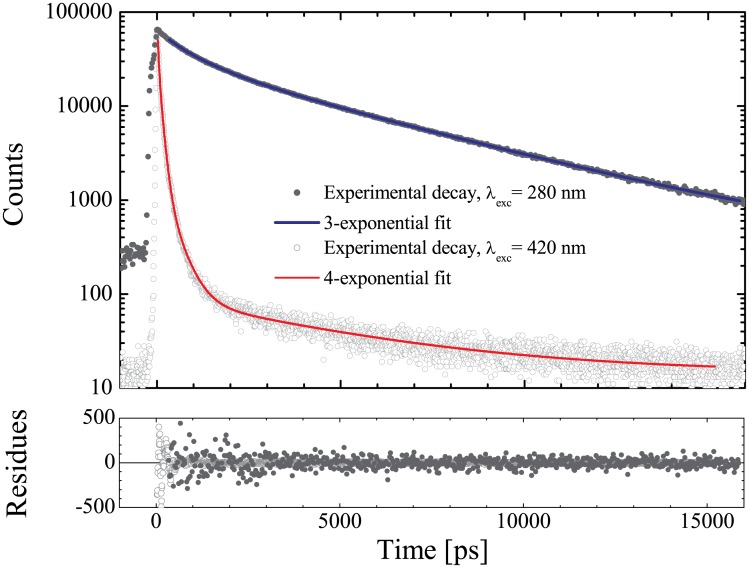
Fig 7. Fluorescence decay patterns of K2T23.
Exemplary decay distributions obtained for K2T23 dissolved in isopropanol upon excitation at 280 nm (full dots), and 420 nm (empty circles). The continuous blue line represents the best-fitting curve for the former according to a tree-exponential decay function, while the red line is the best-fitting curve for the latter to a four-exponential decay model. The corresponding residual plots are reported in the lower panel.

