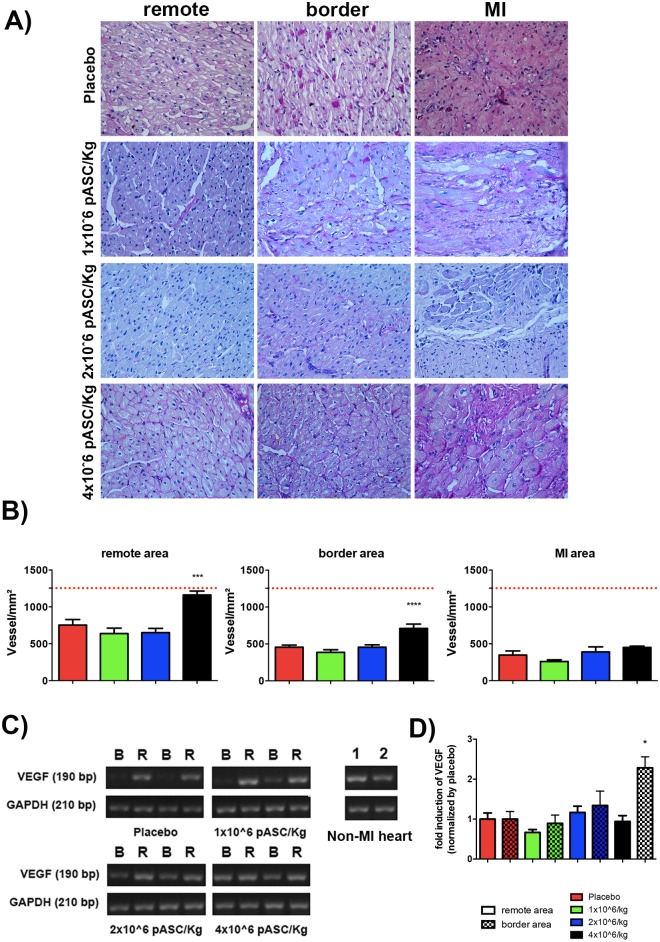
Fig 2. Injection of 4 million cell/Kg increased vascularization in border and remote areas of LV post-MI.
Histological analyses of representative remote, border and MI areas of LV and subsequent quantification of vessels by manual counting (Periodic Acid Shift staining). A) representative images of stained by PAS per area and group. B) quantification of vessel number per area of tissue (in mm2) in remote, border and MI areas. The red dotted line represents the average number of vessels measured in LV of healthy pigs (N = 3). C and D) Semi-quantitative analysis of VEGF expression in border (B) and remote (R) areas of left ventricles for each experimental group. C) PCR products were loaded into agarose gels (two representative animals of each group are shown in the figure D) and band intensity was quantified and normalized by GAPDH expression (n = 4 animals per group). LV tissue from healthy pig was used as positive control. * p<0.05 compared to all the other experimental groups in different areas (ANOVA with Bonferroni post-test). Data are means ± SEM.

