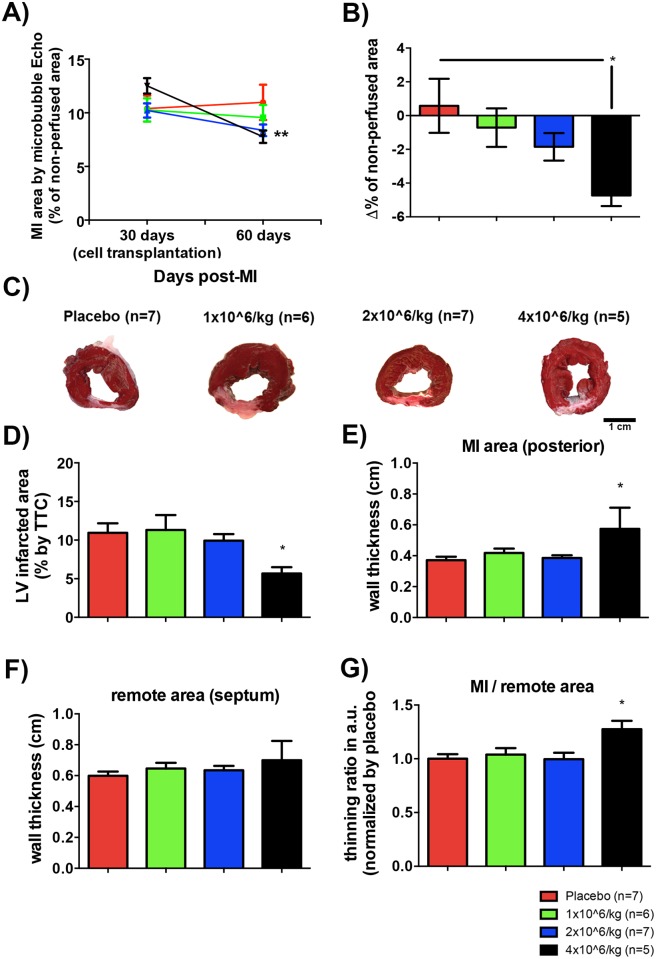
Fig 3. Injection of 4 million cell/Kg reduced left ventricle injured area.
A) Percentage of MI (non-perfused area of LV) before and after pASC injection quantified by planimetry using micro-bubble contrasting images (differences are significant 4 million cell/Kg comparing time, ** p<0.005, Student’s t-test). B) Δ% of non-perfused area for the four experimental groups (Δ% = (% after cell injection)–(% before cell injection) (difference is significant between 4 million cell/Kg injection and placebo group * p<0.05, One-way ANOVA with Bonferroni post-test). C) Representative papillary level slices after TTC stain. D) Averaged percentage of infarcted area for each experimental group (difference is significant between 4 million cell/Kg injection and placebo group * p<0.05, One-way ANOVA with Bonferroni post-test). E) Averaged thicknesses of posterior (MI) wall for each experimental group (difference is significant between 4x10^6 cell injection and placebo group * p<0.05, One-way ANOVA with Bonferroni post-test). F) Averaged thicknesses of septum (remote) wall for each experimental group. G) Thinning ratio (MI wall thickness/remote wall thickness) normalized by thinning ratio of the placebo group (difference is significant between 4 million cell/Kg injection and placebo group * p<0.05, One-way ANOVA with Bonferroni post-test). Data are means ± SEM.

