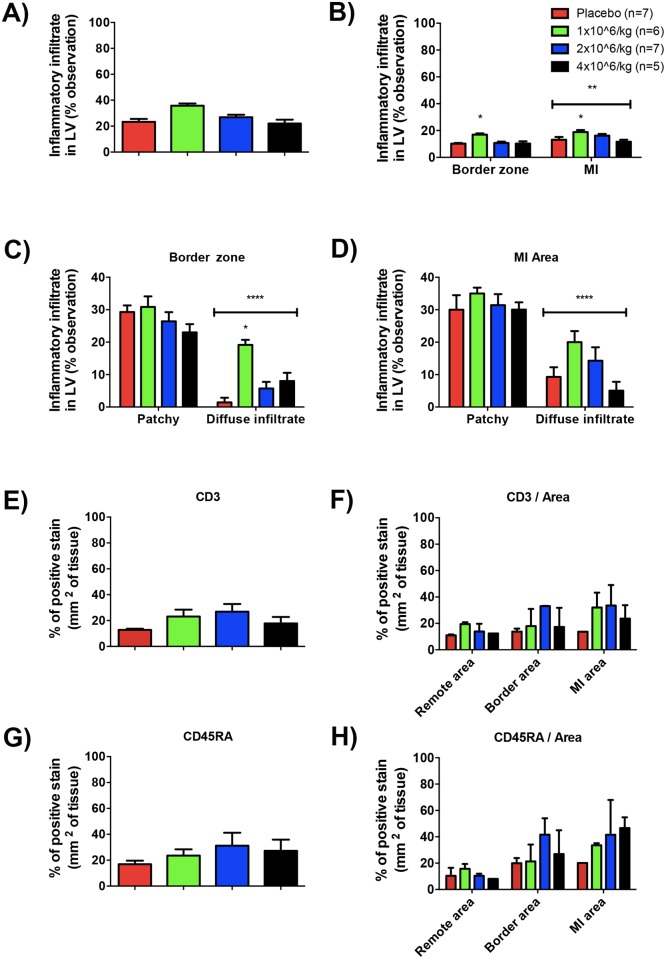
Fig 5. Injection of 4 million cell/Kg did not trigger increased cellular inflammatory response into the heart.
Based on, histological slices stained with H&E and an observational method (grade score) the inflammatory profile of infarcted LV tissue was assessed. A) Frequency of total inflammatory cells observed inside LV muscle for all experimental groups (difference is significant between 1 million cell/Kg injection vs. placebo, 2 and 4 million cell/Kg groups; ** p<0.005, One-way ANOVA with Bonferroni post-test). B) Frequency of inflammatory cells per area observed inside LV muscle for all experimental groups (difference is significant between 1 million cell/Kg injection vs. placebo, 2 and 4 million cell/Kg groups on both areas (border and MI); * p<0.05 and MI vs. border area, ** p<0.005 (area effect), Two-way ANOVA with Bonferroni post-test). C) Frequency of inflammatory cells per type observed inside the border area of LV muscle for all experimental groups (difference is significant between 1 million cell/Kg injection vs. placebo, 2 and 4 million cell/Kg groups; * p<0.05 and diffuse vs. patchy infiltration, **** p<0.0001 (type of infiltrated cells effect), Two-way ANOVA with Bonferroni post-test). D) Frequency of inflammatory cells per type observed inside the MI area of LV muscle for all experimental groups (difference is significant between diffuse vs. patchy infiltration, **** p<0.0001 (type of infiltrated cells effect), Two-way ANOVA with Bonferroni post-test). To improve quality of the observation, antibody-specific immunohistochemistry reactions against CD3 and CD45RA lymphocyte markers were performed. E) Quantification of CD3-positive cells by automatic counting to measure the percentage of positive stain on representative immunohistochemistry slides for all experimental groups. F) Quantification of CD3-positive cells per area of LV tissue. G) Quantification of CD45RA-positive cells. H) Quantification of CD45RA-positive cells per area of LV tissue. Data are mean ± SEM.

