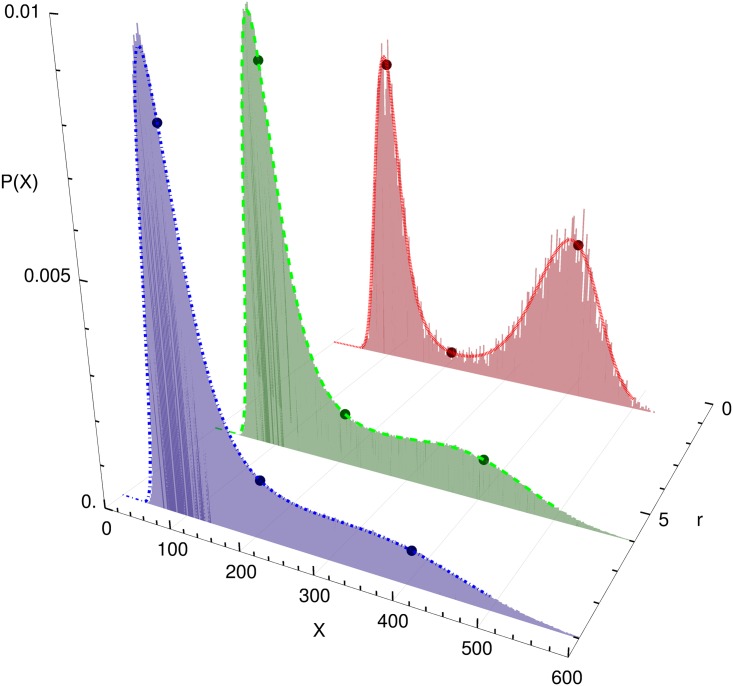
Fig 3. Comparison of stochastic simulation and Fokker-Planck-Equation.
Stationary distributions obtained by stochastic simulation (histograms) and by solving the Fokker-Planck-Equation (lines) for different values of the burst size r (other parameters: ). The dark dots indicate the fixed points of the deterministic model, which do not depend on r.

