Figure 7.
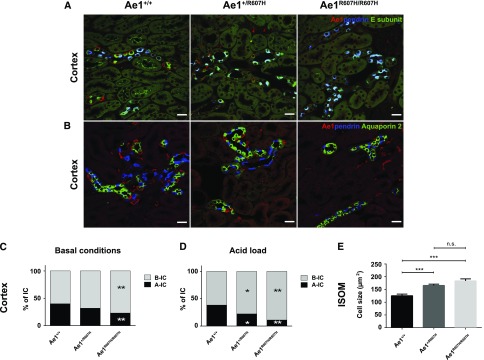
Cortical CDs of Ae1+/R607H and Ae1R607H/R607H mice are depleted of A-ICs. (A) Costaining for Ae1 (red), pendrin (blue), and the E-subunit (green) of the V-type ATPase. Pendrin-negative cells that stain for the E-subunit also label for Ae1 and thus represent A-ICs. Scale bar: 25 µm. (B) Costaining for Ae1 (red), pendrin (blue), and Aquaporin 2 (green). Scale bar: 25 µm. (C and D) Quantification of A-ICs and B-ICs in the cortex at baseline (C) and after acid challenge (D). The number of cortical A-ICs is strongly reduced in Ae1+/R607H and Ae1R607H/R607H mice. (E) Cross-sectional area of individual A-ICs was increased in mutant compared with wild-type mice in the inner stripe of the outer medulla (ISOM). n=30 cells each. *P<0.05; **P<0.01; ***P<0.001 (one-way ANOVA and Tukey multiple comparison).

