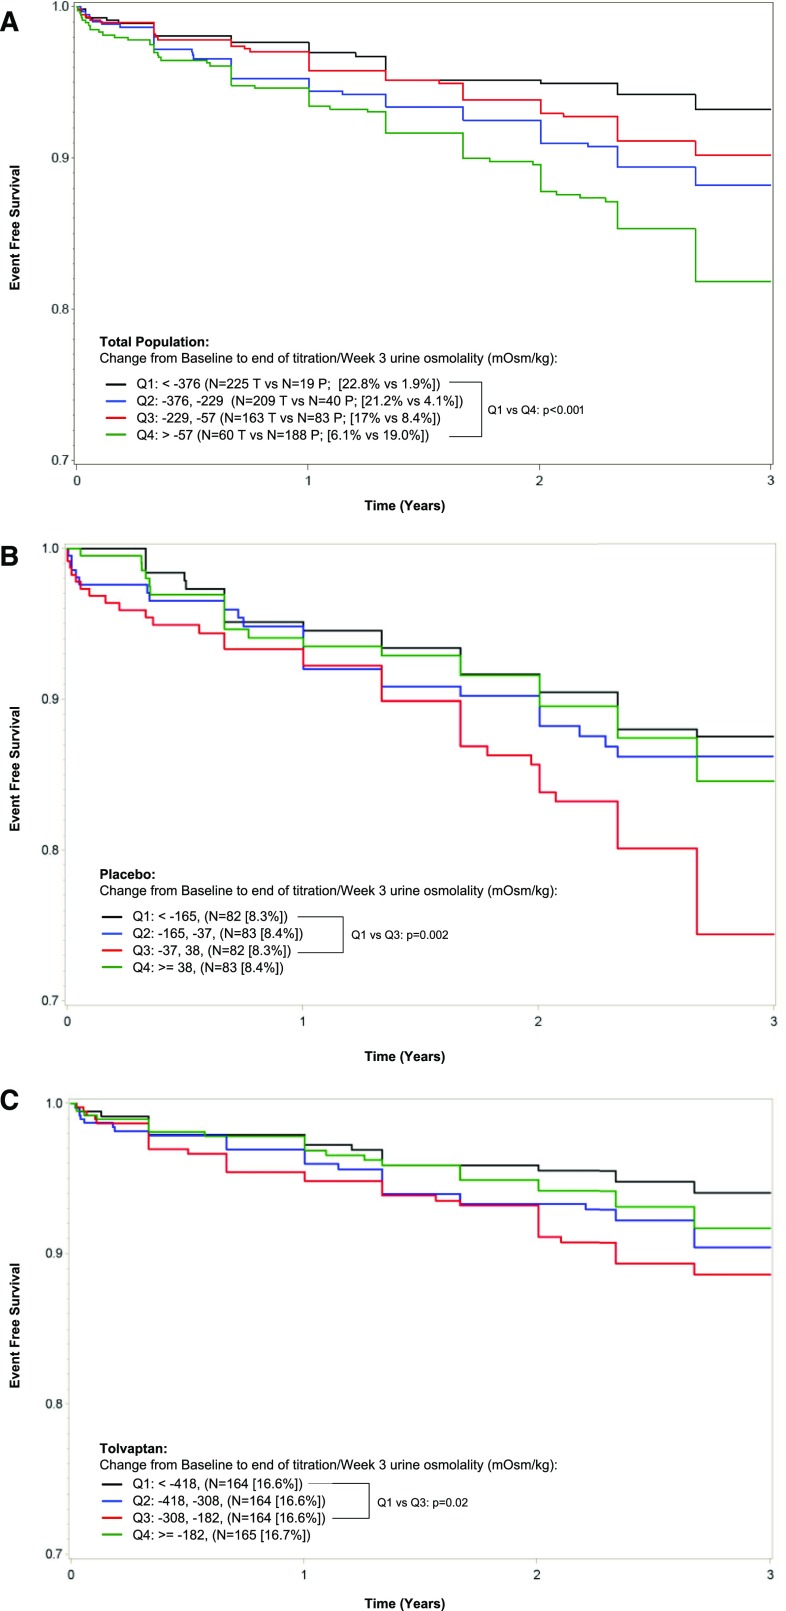
Figure 4.
Change in Uosm from baseline to EOT and time to multiple ADPKD clinical progression events in the ADPKD population. Quartiles of changes in Uosm from baseline to EOT are presented for the whole population (A) and the placebo (B) and tolvaptan (C) groups, in relation to ADPKD clinical progression events defined as worsening renal function or pain. Q1–Q4, quartiles 1–4.

