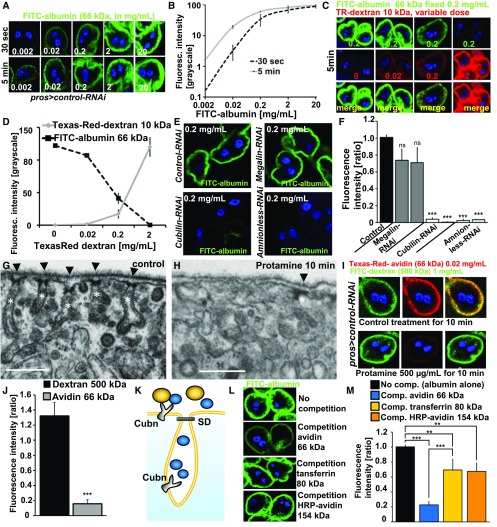
Figure 2.
Tracer endocytosis characteristics of GCN support a model of size-dependent filtration across slits and consecutive uptake via Cubilin/Amnionless coreceptors. (A) GCNs rapidly endocytose FITC-albumin. Fluorescence intensity increases with higher dose or incubation time (30 seconds versus 5 minutes). (B) Quantitation of fluorescence intensity after FITC-albumin exposure at two different incubation times using ImageJ shows linear increase until reaching saturation at higher concentrations. Values are presented as a mean±SD from the three brightest cells each from two independent experiments. (C) Simultaneous incubation with two small tracers, FITC-albumin (66 kD) and Texas-Red–dextran (10 kD), for 5 minutes. Increasing the dose of Texas-Red–dextran 10 kD reduces the uptake of FITC-albumin, whose applied concentration was kept constant. This suggests competition for uptake between both dyes. (D) Quantitation of fluorescence for coincubation of FITC-albumin at constant dose and variable concentrations of Texas-Red–dextran (10 kD). Intensity is recorded as grayscale (0–255) using ImageJ. FITC-albumin uptake is decreasing proportionally to the applied concentrations and increasing uptake of Texas-Red–dextran 10 kD. Offering Texas-Red–dextran in a tenfold mass excess reduces uptake of FITC-albumin to minimal levels. Values are presented as a mean±SD, n=3 per individual tracer dosage. (E) Representative images of fluorescence after incubation with FITC-albumin for 30 seconds at 0.2 mg/ml for control experiments used for normalization (GFP-RNAi) and RNAis for protein scavenger receptors. Cubilin-RNAi and Amnionless-RNAi showed strong reduction of the fluorescent signal. (F) Quantitation of FITC-fluorescence of (E) using ImageJ upon silencing of Megalin, Cubilin, and Amnionless from three independent experiments using two independent RNAis each shows a strong reduction for Cubilin and Amnionless, whereas Megalin has no significant effect. Values are presented as a mean±SD, n=3–4 per genotype. (G) Control treatment of nephrocytes for 10 minutes with PBS showed normal slit diaphragms (arrow heads) and labyrinthine channel morphology (white asterisks). (H) Pretreatment of nephrocytes with protamine 500 µg/ml for 10 minutes leads to a partial loss of labyrinthine channels and slit diaphragms. (I) Exposing cells to PBS alone followed by simultaneous exposure to the large tracer FITC-dextran 500 kD (1 mg/ml) and a small tracer Texas-Red–avidin 66 kD (0.02 mg/ml) resulted in strong uptake of both tracers (upper panel). The same experiment after protamine exposure for 10 min (500 µg/ml) showed strong reduction of avidin uptake whereas the large tracer FITC-dextran was not reduced by the treatment. (J) Quantitation of changes shown in (I) by protamine treatment normalized to mock-treatment for Texas-Red–avidin and FITC-dextran 500 kD shows reduction of 66 kD tracer endocytosis by loss of labyrinthine channels whereas the uptake of FITC-dextran 500 kD is increased in a nonsignificant manner. This suggests that uptake of the small tracer Texas-Red–dextran depends on slit diaphragms and labyrinthine channel surface but uptake of the large tracer FITC-dextran 500 kD is not affected by protamine-induced alteration of ultrastructure. n=5 per treatment. (K) Schematic illustrating hypothesis that competition between tracers depends on passage of the slit diaphragm which thus can serve as a read-out for filtration characteristics. Tracers which pass the slit diaphragm (blue) may approach all of the available receptors inside and outside the labyrinthine channels and thus are able to out-compete other tracers. Tracers whose mass prevents passage of the slit diaphragm (yellow) on the other hand cannot compete for receptors located inside the labyrinthine channels which results in incomplete competition. (L) Shown are representative images of control nephrocytes after incubation with 3 µM FITC-albumin for 5 minutes. The image on top shows FITC-albumin uptake without competition. Competition of FITC-albumin with a tenfold molar excess of tracers of increasing size are shown in a descending order. The tracer avidin (66 kD) competes strongly, whereas the larger tracers transferrin (80 kD) and HRP-avidin (avidin compound whose mass increased to 154 kD by conjugation of two molecules of peroxidase) show mild reduction of FITC-albumin endocytosis. This suggests partial competition and thus implies inability of the two larger tracers to pass the slit diaphragm. (M) Quantitation of experiments from (I). n=3–4 per intervention.

