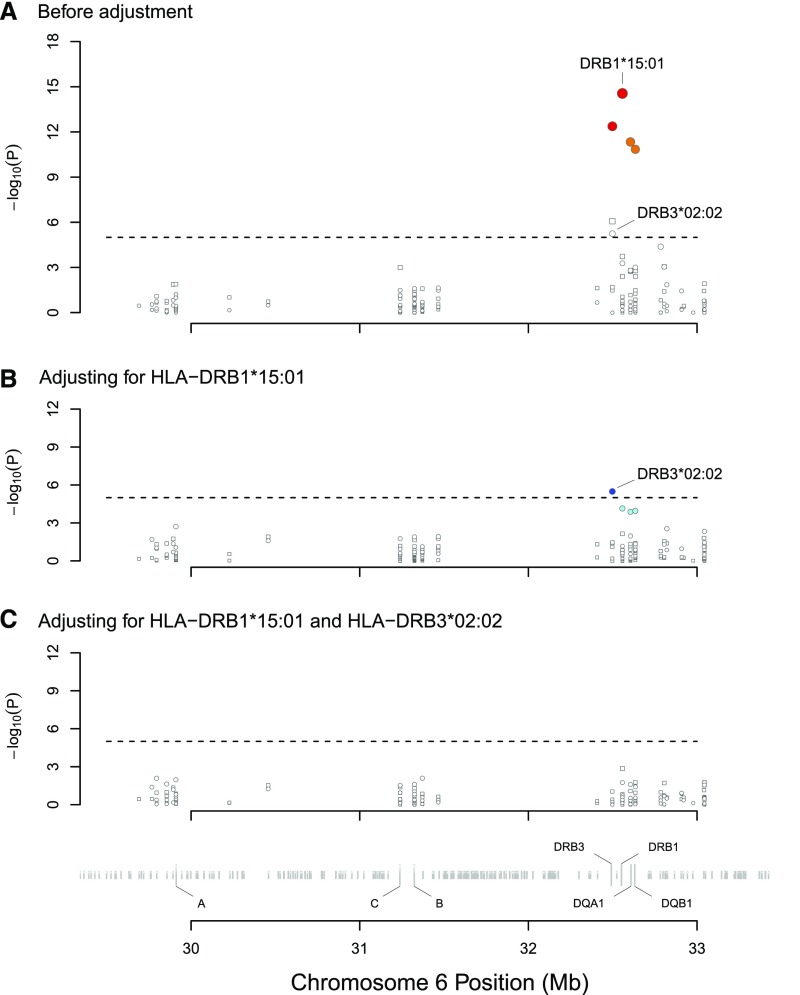
Figure 1.
Association tests between all HLA alleles and PLA2R-related MN in the discovery dataset. Circles denote alleles with an OR>1, whereas squares denote alleles with an OR≤1. (A) shows that the significant signals (P<1×10⁻⁵) were aggregated in the HLA class 2 region; no significant signals were found in the HLA class 1 region. HLA-DRB1*15:01 (OR, 16.9; 95% CI, 8.4 to 34.2; P=2.7×10⁻¹⁵) showed the strongest signal. Colors denote the strength of the LD of the alleles compared with HLA-DRB1*15:01. Red denotes an R2 value of 0.8 or more, orange denotes an R2 value of 0.5 to <0.8, and white denotes an R2 value of <0.25. Three alleles that were tightly linked to HLA-DRB1*15:01 (DRB5*01:01, DQA*01:02, and DQB1*06:02) also showed significant associations. The HLA-DRB3*02:02 (OR, 4.0; 95% CI, 2.2 to 7.2; P=5.7×10⁻⁶) was also significantly associated with PLA2R-related MN. (B) shows the association plot after adjusting for HLA-DRB1*15:01. The allele HLA-DRB3*02:02 maintained its independent significant association. Colors denote the strength of the LD of the alleles compared with HLA-DRB3*02:02. Blue denotes an R2 value of 0.8 or more, cyan denotes an R2 value of 0.25 to <0.5, and white denotes an R2 value of <0.25. (C) shows that none of the other alleles were independently associated with the disease after adjusting for HLA-DRB1*15:01 and HLA-DRB3*02:02.

