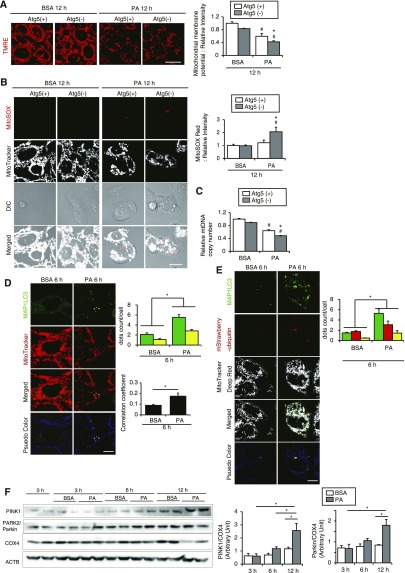
Figure 4.
PA-induced mitophagy protects PTCs from mitochondrial injury. (A and B) The mitochondrial membrane potential (A) and the mitochondrial ROS (B) of autophagy-competent and -deficient PTCs treated with either 0.25% BSA or 0.25 mM PA for 12 hours were assessed by TMRE and MitoSOX Red stainings, respectively (n=4–6). Quantitative data of relative intensity were also provided. (C) The mtDNA copy number of autophagy-competent and -deficient kidney PTCs was quantified after treatment with either 0.25% BSA or 0.25 mM PA for 12 hours. (A–C) Values are normalized by the signal intensity of BSA-treated autophagy-competent PTCs. (D and E) PTCs stably expressing GFP-MAP1LC3 (D) or GFP-MAP1LC3 and mStrawberry-ubiquitin (E) were stained with MitoTracker Red FM (D) or MitoTracker Deep Red FM (E) after treatment with either 0.25% BSA or 0.25 mM PA for 6 hours (n=5). (D) Yellow dots in merged images represent colocalization of mitochondria and autophagosomes. Colocalization was assessed by Pearson correlation. (E) White dots in merged images represent colocalization of ubiquitinated mitochondria and autophagosomes. (F) Western blot analysis (PINK1, PARK2/Parkin, and COX4) (n=4). Actin, β (ACTB) was used as loading control. The mean value of untreated controls at the baseline was adjusted to “1” as a reference. Bars: 10 μm. Data are provided as mean±SEM. Statistically significant differences: *P<0.05 versus autophagy-competent cells of corresponding treatment; #P<0.05 versus BSA-treated control cells (A–C); *P<0.05 (D and E). Atg5(+), autophagy-competent PTC; Atg5(−), autophagy-deficient PTC. All images are representative of multiple experiments.

