Figure 4.
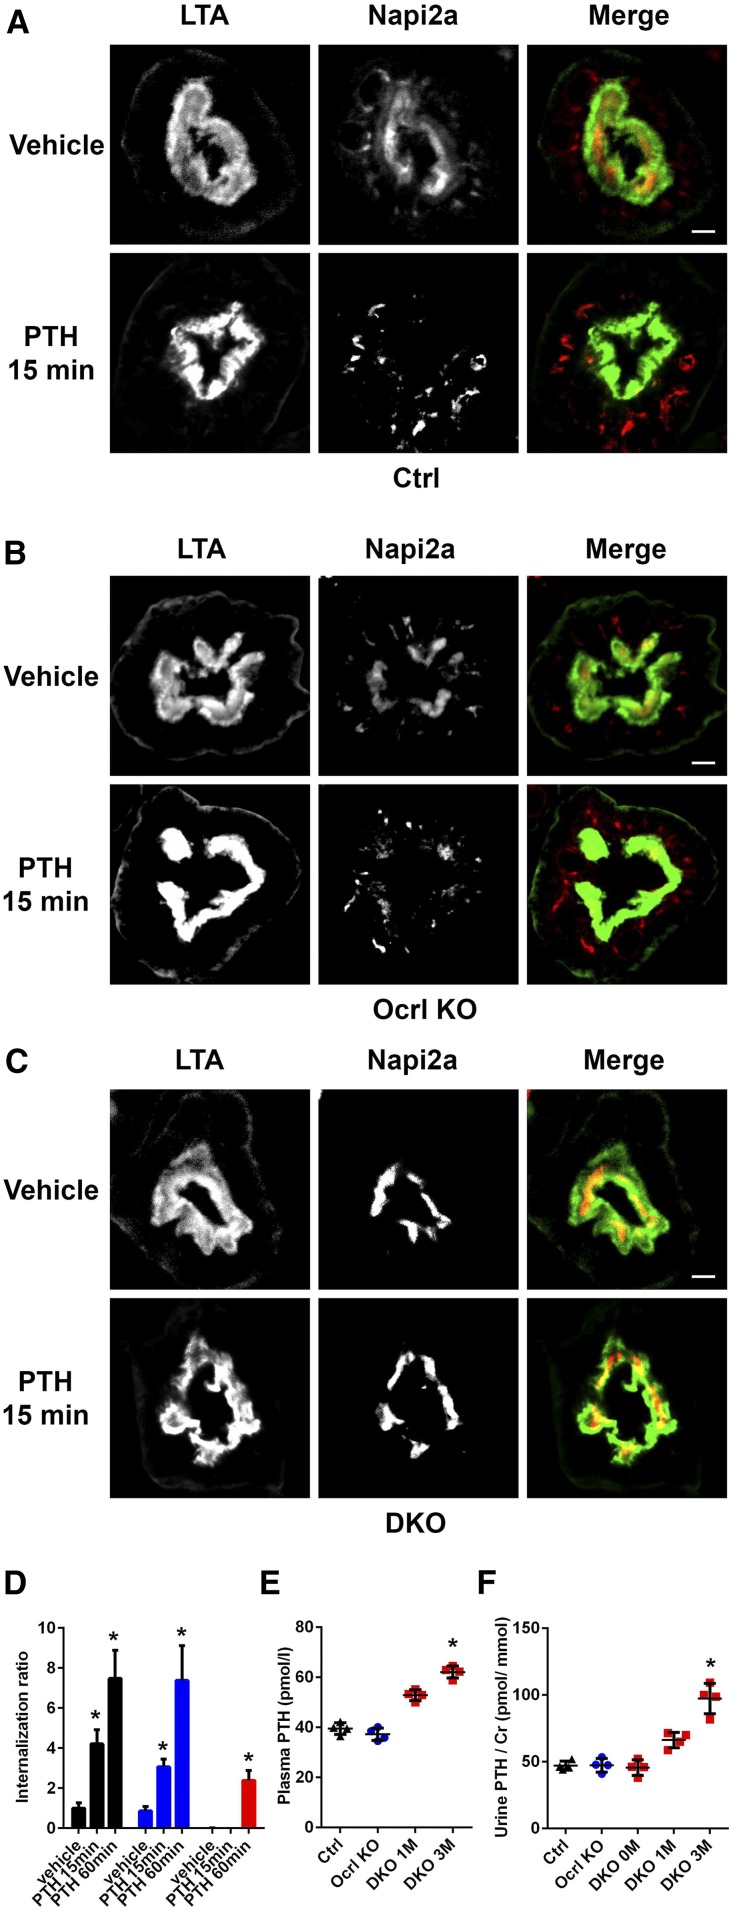
Uptake of NaPi2a after PTH treatment is impaired in the cDKO mice. (A) Representative immunofluorescence images of control kidney proximal tubules at 1 month after doxycycline induction stained with NaPi2a 15 minutes after vehicle or PTH injection. FITC-LTA is shown in green. Scale bars, 10 μm. (B) Representative immunofluorescence images of Ocrl KO kidney proximal tubules at 1 month after doxycycline induction stained with NaPi2a 15 minutes after vehicle or PTH injection. FITC-LTA is shown in green. Scale bars, 10 μm. (C) Representative immunofluorescence images of cDKO kidney proximal tubules at 1 month after doxycycline induction stained with NaPi2a 15 minutes after vehicle or PTH injection. FITC-LTA is shown in green. Scale bars, 10 μm. (D) Quantification of NaPi2a internalization (A–C) (Supplemental Figure 2A), where the cytoplasmic to tubular brush border Napi2a intensity is calculated and expressed as the internalization ratio (black bar, control; blue bar, Ocrl KO; and red bar, cDKO mice). *P<0.05 (n=3). (E) Plasma and (F) urine PTH levels in control, Ocrl KO, and cDKO mice. *P<0.05 (n=4).

