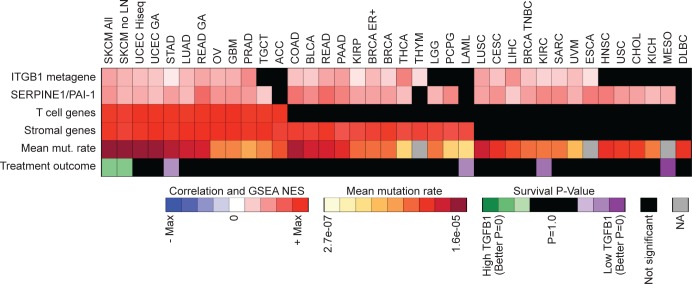
Fig 3. TGFB1 correlations for various tumor types.
Heatmap displaying correlations between TGFB1 expression and active ITGB1 (ITGB1 metagene) and TGF-β activity (SERPINE1/PAI1) for various tumor types (S4 Table). The heatmap also includes rows with mean mutation rates (mean mut. rate), TGFB1 Kaplan-Meier treatment outcome log-rank p-values (Treatment outcome), and GSEA Normalized Enrichment Score (NES) for T-cell (T cell genes) and stromal (Stromal genes) gene sets for each of the tumor types.

