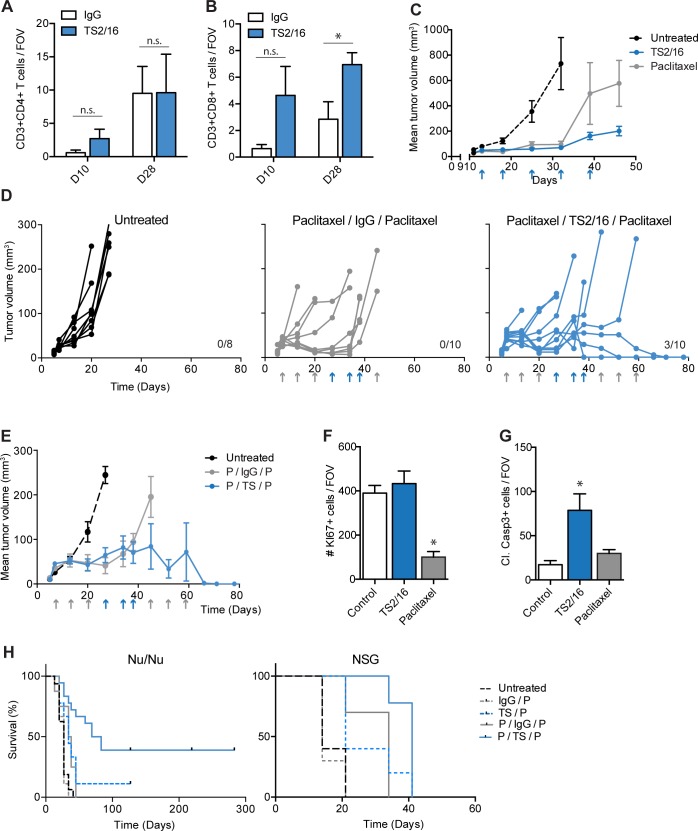
Fig 4. TS2/16 attenuates tumor growth by indirectly increasing apoptosis.
(A-B) IHC quantification on A375 NLS-mCerulean tumors treated with IgG control (white bars) or TS2/16 (blue bars) antibody. The number of (A) CD3+CD4+, (B) CD3+CD8+ T cells was counted per field of view (FOV), and the average of ≥5 FOV in ≥3 tumors per condition was plotted in bar graphs. D10: tumors were treated once and were harvested 10 days after injection (2 days after treatment). D28: Tumors were treated 3x and were harvested 28 days after injection (5 days after last treatment). (C) Mean tumor volume of A375 tumors in nu/nu mice left untreated (dashed line), treated with TS2/16 (blue line) or Paclitaxel (grey line). Treatments are indicated with an arrow. N ≥ 5 mice per group. (D) A375 tumor growth measurements in nu/nu mice. Each curve represents the growth of a single tumor. Treatments are indicated with an arrow: TS2/16 or IgG (blue), paclitaxel (grey). Mice were sacrificed when tumors reached > 130 mm3, cured mice are indicated by the number on the right. N ≥ 8 tumors per group. (E) Mean tumor volume of A375 tumors shown in D. Mice were left untreated (dashed line), treated with paclitaxel/IgG/Paclitaxel (grey line) or treated with paclitaxel/TS2/16/paclitaxel (blue line). Treatments are indicated with an arrow: TS2/16 or IgG (blue), paclitaxel (grey). Mice were sacrificed when tumors reached > 130 mm3. N ≥ 8 mice per group. (F-G) IHC quantification on A375 NLS-mCerulean tumors treated with IgG control (white bars) or TS2/16 (blue bars) antibody for 5 weeks. The number of KI67+ cells (proliferation, F) or Cl. Casp3+ cells (apoptosis,G) per FOV was measured. N ≥ 10 FOV per condition. (H) Kaplan Meier survival curves of nu/nu and NSG mice respectively injected with A375 tumor cells and treated with indicated treatment regimen: IgG (IgG control antibody), P (paclitaxel), TS (TS2/16). Mice were sacrificed when tumors reached >130 mm3. N ≥ 10 mice per group. Survival analyses with Bonferroni post-hoc: in both nu/nu and NSG mice IgG/P vs TS/P and P/IgG/P vs P/TS/P was significant (P-value≤ 0.05). Error bars, SEM; Two-sided unpaired T-tests (A—B) or 1-way ANOVA with Bonferroni post-hoc test comparing treatments to control (F—G): * P-value ≤ 0.05, n.s. P-value > 0.05.

