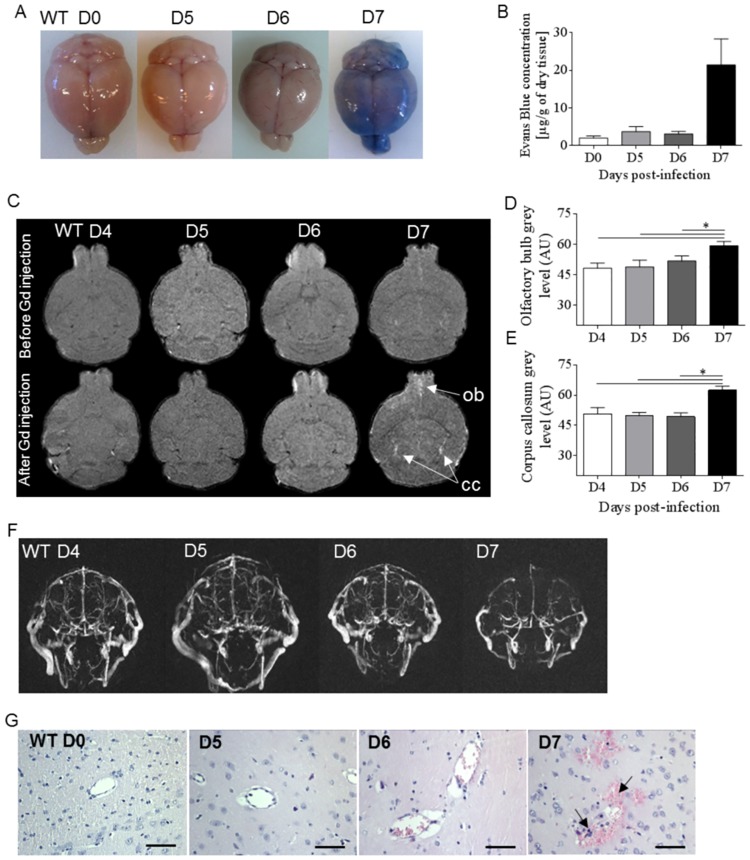
Fig 3. Kinetics of ECM-induced BBB leakage and vascular damage after PbA-infection.
(A-B) Blood brain barrier permeabilization was investigated in WT mice with Evan’s Blue injection on day 5, 6 and 7 after PbA-infection, and compared to naïve mice. Typical images (A) and bar graph of Evan’s blue leakage (B) expressed as μg of blue per g of dry tissue (n = 3 per day). (C-F) Brain imaging using MRI and MRA analysis in PbA-infected WT mice at early time points on day 4, 5, 6 and during late ECM on day 7 post-infection. Brain longitudinal MRI images of PbA-infected WT mice before and after intravenous injection of Gadolinium (Gd) with distinct anomalies in the olfactory bulb (ob) and the corpus callosum (cc) are indicated by arrows (C). Bar graphs of olfactory bulb (D) and corpus callosum (E) mean grey level intensity from MRI images after Gd injection are shown (n = 5 per group). Representative images of vascular blood flow perturbation analyzed by MRA of PbA-infected WT mice 4 to 7 days post-infection (F). MR images are representative of 5 mice per day. (G) Brain histology assessed on day 5, 6 and 7 after PbA-infection in WT mice. Arrows indicate red blood cell / leucocyte sequestration and hemorrhages (hematoxylin-eosine staining; scale bar 50μm). Representative images of 2 independent experiments. Kruskal-Wallis was applied, followed by Dunn’s comparison test (*p≤0.05).

