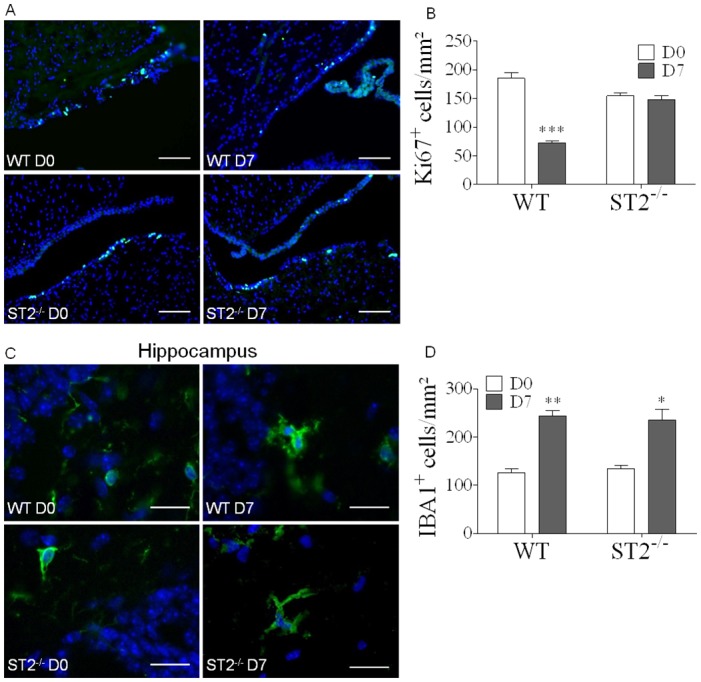
Fig 4. Preserved neuron proliferation after PbA-infection in the absence of IL-33/ST2 pathway.

(A) Immunofluorescent staining of cell proliferation marker Ki67, showing neurogenesis in the ventricle wall in WT and ST2-/- mice 7 days post-PbA infection. Scale bar 100μm. (B) Cell counts of Ki67+ cells in ventricle wall sections from WT and ST2-/- infected or naïve mice. These results are expressed as mean ± SEM, n = 4 to 5 mice in 2 independent experiments with 5 fields analyzed per mouse. (C) Immunofluorescent staining of microglia marker IBA1, on brain sections, showing microglia morphology in hippocampus from WT and ST2-/- mice, 7 days post-PbA-infection. Scale bar 20μm. (D) Cell counts of IBA1+ cells from C, to compare microglia proliferation in WT and ST2-/- brain, 7 days post-PbA infection. These results are expressed as mean ± SEM, n = 3 mice per group in 2 independent experiments with 5 fields analyzed per mouse. Kruskal-Wallis was applied, followed by Dunn’s comparison test (*p≤0.05, **p≤0.01, ***p≤0.001).
