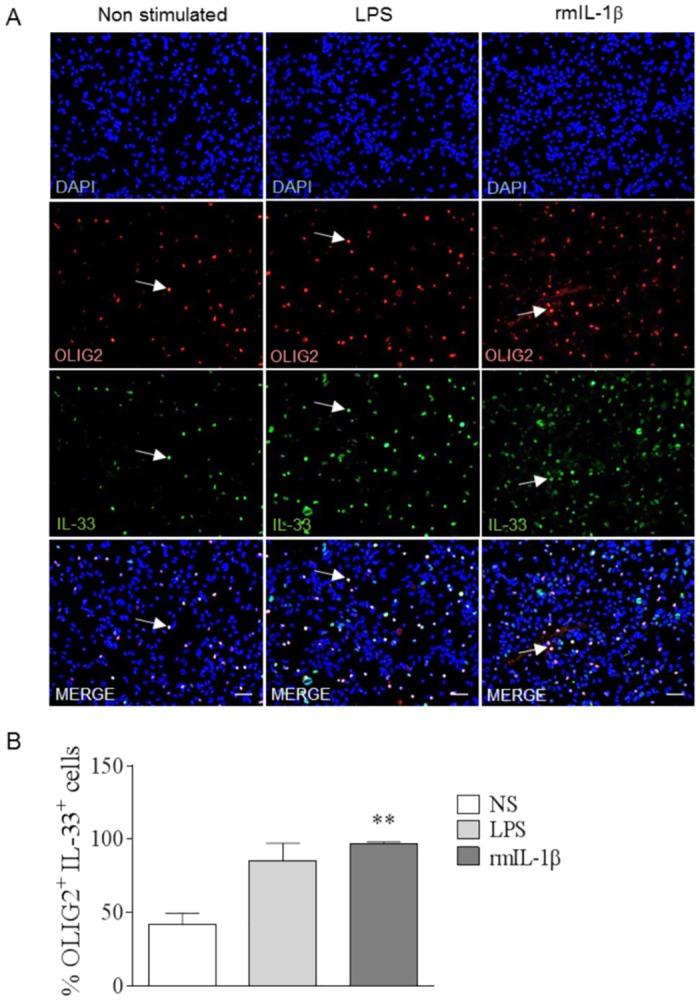
Fig 8. IL-1β induces IL-33 production by oligodendrocytes.

(A) WT mixed glial cell cultures from newborn mice were stimulated with IL-1β (30ng/mL) or LPS (10μg/mL), as a positive control, for 24 hrs, then fixed and immunostained for OLIG2 and IL-33. These images are representative of 2 independent experiments. Arrows indicate colocalization of IL-33 with OLIG2. Scale bar 100μm. (B) Percentage of OLIG2+ cells expressing IL-33 from A. These results are expressed as mean ± SEM, n = 3 mice per group in 2 independent experiments with 5 fields analyzed per slide. Kruskal-Wallis was applied, followed by Dunn’s comparison test (**p≤0.01).
