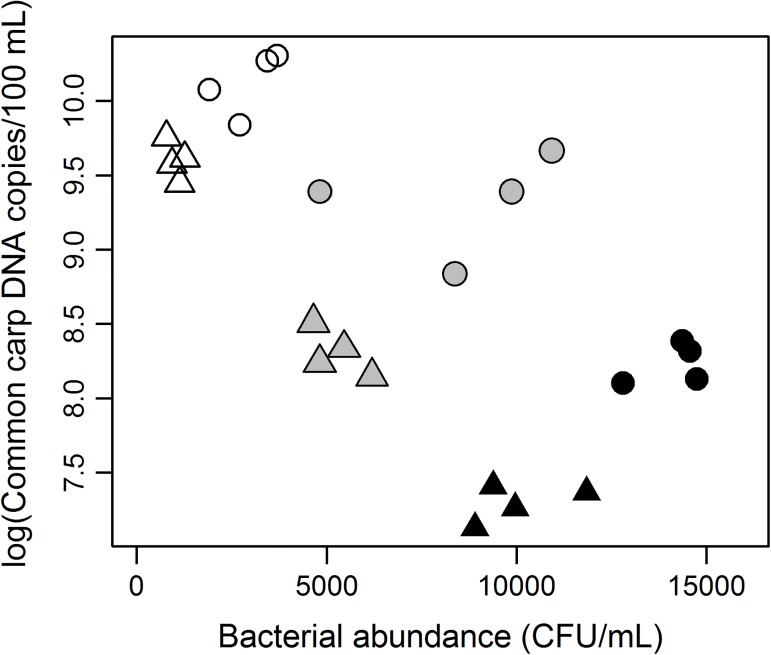
Fig 2. Relationship between bacterial abundance and DNA concentration of common carp in water after 12 and 24 h of incubation.
Data for 12- and 24-h incubation trials are represented as circles and triangles, respectively. White, gray, and black plots represent water temperature settings of 10°C, 20°C, and 30°C, respectively.

