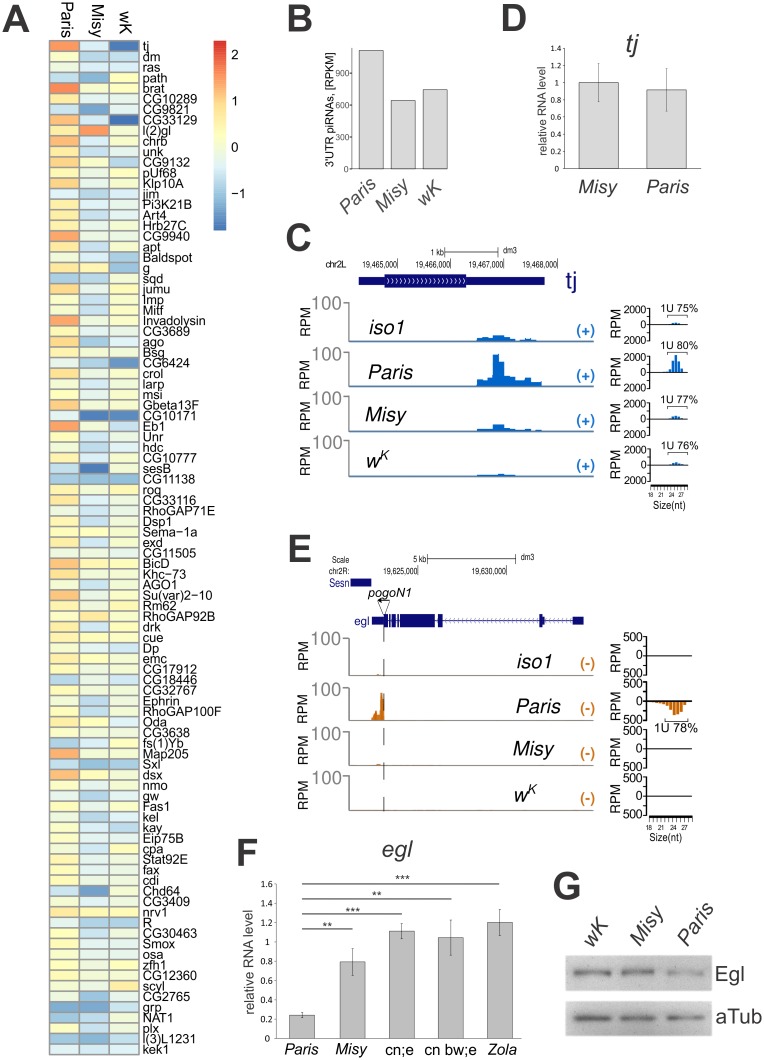
Fig 5. Polymorphism in the abundance of the 3’–genic piRNAs in R strains.
(A) Heatmap shows RPKM (Reads Per Kilobase Million, only 24–29 nt reads were considered) corresponding to the most active 3’ genic piRNA clusters in follicular cells [35] in Paris, Misy and wK strains relative to iso-1 strain. Heatmap is sorted for decreasing RPKM count for 3' genic piRNA clusters in Paris strain. A comparison of genome sequences revealed no significant differences in the regions comprising six major genic piRNA clusters in these R strains (S9 Fig). (B) Abundance of small RNA reads (RPKM, 24–29 nt reads were considered) mapping to the genic piRNA clusters [35] in Paris, Misy and wK. (C) Profile of small RNA density at tj locus in ovaries of Misy, Paris, wK and iso-1 strains. Length distribution of tj small RNAs is plotted on the right. Percentages of reads having 1U bias are indicated. (D) RT-qPCR analysis of tj expression in ovaries of R strains. (E) Profile of small RNA density at the egl locus in ovaries of iso-1, Misy, wK and Paris strains. Length distribution of egl small RNAs is plotted on the right. Percentages of reads having 1U bias are indicated. (F) RT-qPCR analysis of egl expression in ovaries of R strains. Asterisks indicate statistically significant differences relative to Paris (* P < 0.05 to 0.01, ** P < 0.01 to 0.001, *** P < 0.001, t-test). (G) Western blot of wK, Misy and Paris ovary extracts probed with antibodies against Egl and α-tubulin. The level of Egl protein is 1.5±0.2 fold higher in ovaries of strain Misy than in Paris. The value is mean±SD for two anti-Egl western blot experiments with three dilutions of ovary extracts normalized to α-tubulin.

