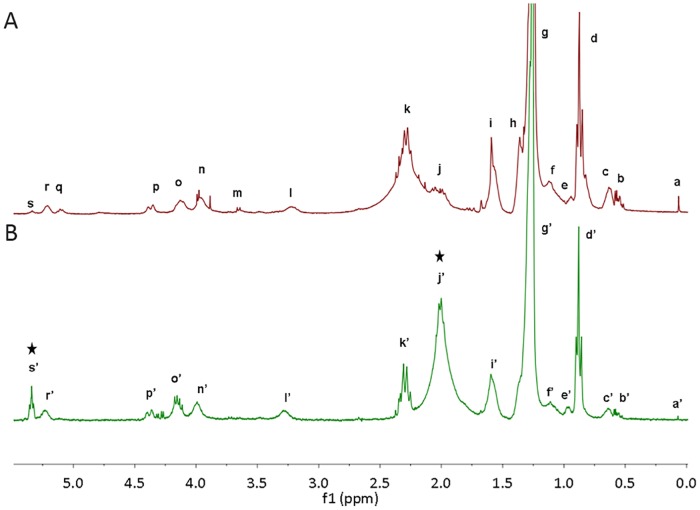
Fig 5. 1H NMR spectra (CDCl3, 300.19 MHz) from lipid mixtures show an increase in the proportion of double bonds.
Comparison of the 0.0–5.5 ppm regions of the 1H NMR spectra from the whole lipid extract of engineered E. coli C41 (DE3) cells expressing the tDGAT (B, low green spectrum) and the whole lipid extract of the same bacteria without any heterologous protein (A, upper red spectrum). Peaks are named from right to left and attributions are detailed in S1 Table. Black arrows point to the peaks indicating an increment in the proportion of double bonds in the recombinant strain. For more clarity, the spectrum is zoomed and only the region where all signals appear is shown. The only signal outside this region is the CDCl3 solvent residual peak (7.26 ppm, data not shown).

