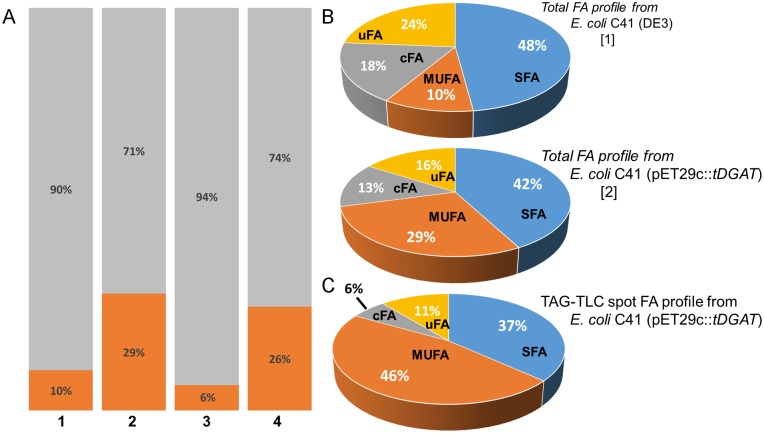
Fig 6. FA profile in E. coli cells expressing tDGAT.
(A) Bar graphs showing the MUFA percentage (dark orange) among the whole FA pool in diverse E. coli strains [1: WT E. coli C41 (DE3); 2: E. coli C41 (pET29c::tDGAT); 3: WT E. coli BW27783; 4: E. coli BW27783 (pBAD33::tDGAT)] (B) Circular graphs showing a more detailed comparison among the whole lipid extractions from E. coli C41 (DE3) [1] and E. coli C41 (pET29c::tDGAT) [2] with the TAG-TLC spot from E. coli C41 (pET29c::tDGAT) (C). MUFA are presented in dark orange, saturated FA in blue, confirmed cyclopropyl FA in grey and unidentified FA (inferred from literature) in yellow.

