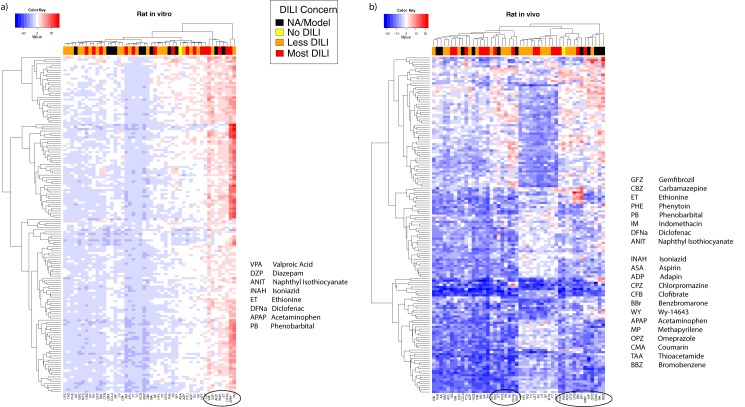
Fig 3. Hierarchical clustering of top ranked genes in both of the Rat models in vivo, in vitro.
In red values with high MB statistic and in blue negative MB values. Rat in vitro (left) and Rat in vivo (right). Colored bar on the top shows DILI concern, black means unassigned or model compound, yellow indicates No DILI, orange Less DILI and red Most DILI.

