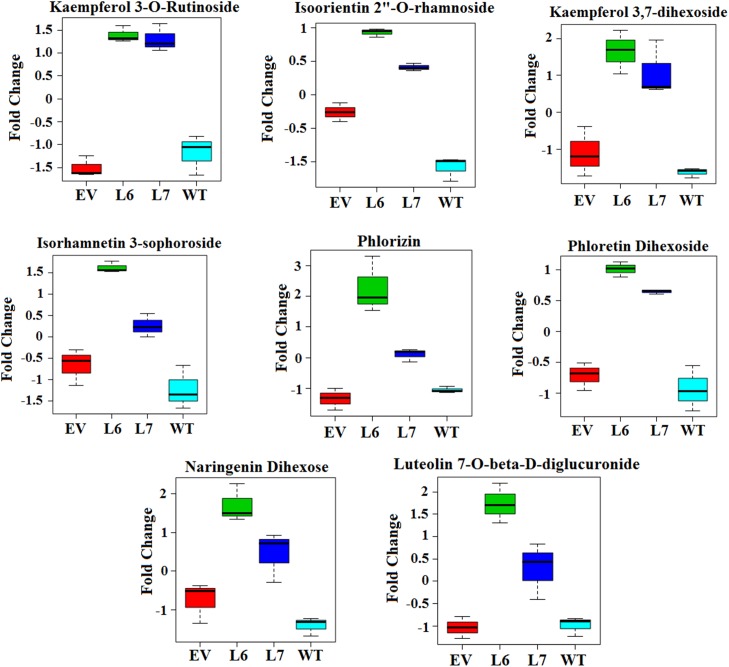
Fig 4. Relative differences in concentrations between control (WT, EV) and transgenic tomato samples (L6, L7) for eight identified flavonoid metabolites.
The relative increase of concentration was based on average intensity fold change between samples. Separate images were created with Metaboanalyst using data generated by LC-MS.

