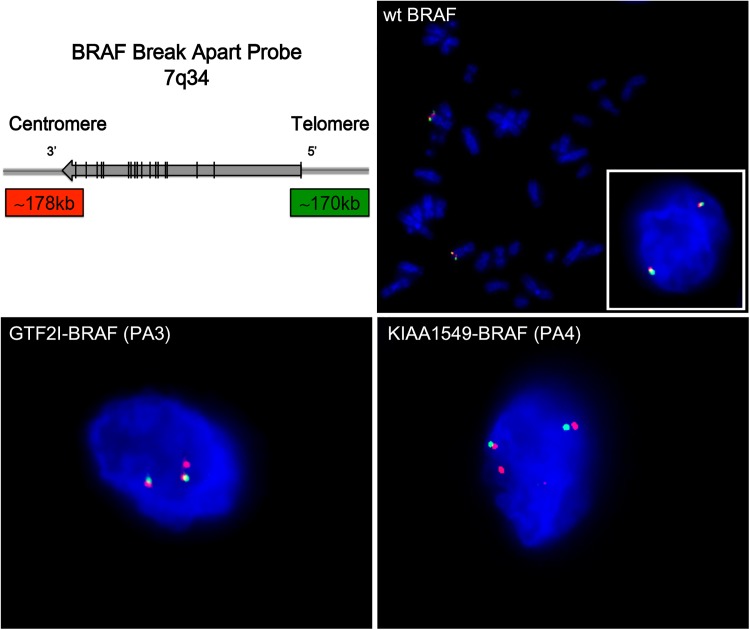
Fig 5. FISH analysis of BRAF fusions with BRAF break apart assay.
Upper left: Schematic presentation of the BRAF break apart assay, consisting of a 5’ 170 kb green probe and a 178 kb 3’ red probe in 7q34. Upper right (wt BRAF): Metaphase FISH of normal control and Interphase FISH of fusion-negative cell (right corner) showing two wild type BRAF alleles, displayed as a merged (yellow) or two adjacent green (5’)/red (3’) signals. Lower panels: Fusion-positive tumor cells (GTF2I-BRAF in PA3 and KIAA1549-BRAF in PA4) showing the BRAF split pattern; two normal BRAF alleles green /red signals, as well as one additional split BRAF red signal representing the duplicated 3’ region in the fusion gene. The same split signal pattern is seen for different types of BRAF fusions; GTF2I-BRAF in case PA3 and KIAA1549-BRAF in cases PA1-2 and PA4-6 (S3 Fig). Tissue sections were counterstained with DAPI (blue).

