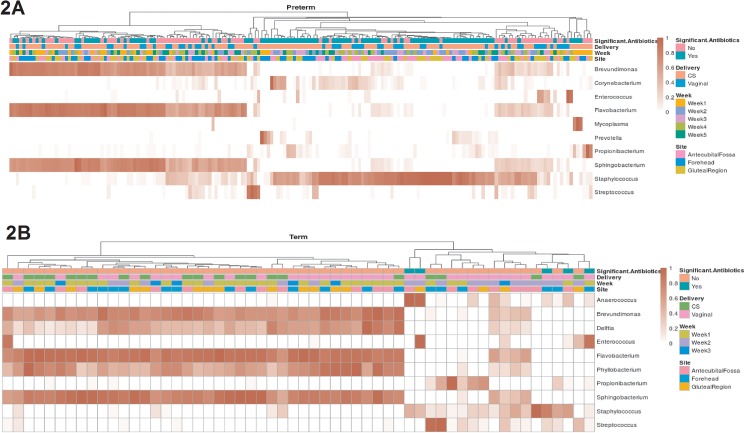
Fig 2. Hierarchical clustering for preterm and term infants, based on relative abundance at the genus level.
Each column represents a sample, with darker red indicating higher relative abundance. The top 10 most abundant genera are shown for preterm (2A) and term (2B) infants, separately. The top four rows show metadata for each sample namely use of significant antibiotics, mode of delivery, week of sample collection and sampling site.

